Konica Minolta 2015 Annual Report Download - page 130
Download and view the complete annual report
Please find page 130 of the 2015 Konica Minolta annual report below. You can navigate through the pages in the report by either clicking on the pages listed below, or by using the keyword search tool below to find specific information within the annual report.-
 1
1 -
2
-
3
-
4
-
5
-
6
-
7
-
8
-
9
-
10
-
11
-
12
-
13
-
14
-
15
-
16
-
17
-
18
-
19
-
20
-
21
-
22
-
23
-
24
-
25
-
26
-
27
-
28
-
29
-
30
-
31
-
32
-
33
-
34
-
35
-
36
-
37
-
38
-
39
-
40
-
41
-
42
-
43
-
44
-
45
-
46
-
47
-
48
-
49
-
50
-
51
-
52
-
53
-
54
-
55
-
56
-
57
-
58
-
59
-
60
-
61
-
62
-
63
-
64
-
65
-
66
-
67
-
68
-
69
-
70
-
71
-
72
-
73
-
74
-
75
-
76
-
77
-
78
-
79
-
80
-
81
-
82
-
83
-
84
-
85
-
86
-
87
-
88
-
89
-
90
-
91
-
92
-
93
-
94
-
95
-
96
-
97
-
98
-
99
-
100
-
101
-
102
-
103
-
104
-
105
-
106
-
107
-
108
-
109
-
110
-
111
-
112
-
113
-
114
-
115
-
116
-
117
-
118
-
119
-
 120
120 -
 121
121 -
 122
122 -
 123
123 -
 124
124 -
 125
125 -
 126
126 -
 127
127 -
 128
128 -
 129
129 -
 130
130 -
 131
131 -
 132
132 -
 133
133 -
 134
134 -
 135
135 -
 136
136 -
 137
137 -
 138
138 -
 139
139 -
 140
140 -
141
-
142
-
143
-
144
 |
 |
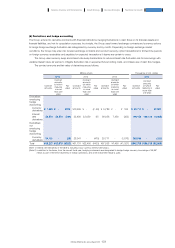
Millions of yen
2015
Level 1 Level 2 Level 3 Total
Financial assets
Investment securities ············································································································ ¥28,305 ¥ - ¥2,228 ¥30,534
Others ····························································································································································· 3,111 1,235 564 4,911
Total ············································································································································································· 31,416 1,235 2,793 35,445
Financial liabilities
Others ····························································································································································· - 1,559 - 1,559
Total ············································································································································································· ¥ - ¥1,559 ¥ - ¥ 1,559
Millions of yen
2014
Level 1 Level 2 Level 3 Total
Financial assets
Investment securities ············································································································ ¥26,103 ¥ - ¥1,517 ¥27,621
Others ····························································································································································· 2,478 324 303 3,106
Total ············································································································································································· 28,581 324 1,821 30,728
Financial liabilities
Others ····························································································································································· - 758 494 1,252
Total ············································································································································································· ¥ - ¥758 ¥ 494 ¥ 1,252
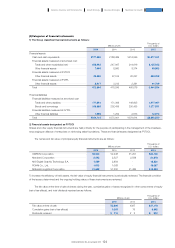
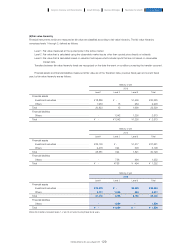
(5)Fair value hierarchy
Financial instruments which are measured at fair value are classified according to fair value hierarchy. The fair value hierarchy
comprises levels 1 through 3, defined as follows:
Level 1: Fair value measured at the quoted price in the active market
Level 2: Fair value that is calculated using the observable market inputs other than quoted price directly or indirectly
Level 3: Fair value that is calculated based on valuation techniques which include inputs that are not based on observable
market data
Transfers between fair value hierarchy levels are recognized on the date the event or condition prompting the transfer occurred.
Financial assets and financial liabilities measured at fair value as of the Transition Date, previous fiscal year and current fiscal
year, by fair value hierarchy are as follows:
Millions of yen
2013
Level 1 Level 2 Level 3 Total
Financial assets
Investment securities ············································································································ ¥18,889 ¥ - ¥1,436 ¥20,325
Others ····························································································································································· 1,933 15 254 2,203
Total ············································································································································································· 20,823 15 1,690 22,529
Financial liabilities
Others ····························································································································································· - 1,342 1,230 2,573
Total ············································································································································································· ¥ - ¥1,342 ¥1,230 ¥ 2,573
(Note) No transfers between levels 1, 2 and 3 occurred during these fiscal years.
129
KONICA MINOLTA, INC. Annual Report 2015
Foundation for GrowthBusiness StrategiesGrowth StrategyCompany Overview and Characteristics Financial Report