Konica Minolta 2015 Annual Report Download - page 36
Download and view the complete annual report
Please find page 36 of the 2015 Konica Minolta annual report below. You can navigate through the pages in the report by either clicking on the pages listed below, or by using the keyword search tool below to find specific information within the annual report.-
 1
1 -
2
-
3
-
4
-
5
-
6
-
7
-
8
-
9
-
10
-
11
-
12
-
13
-
14
-
15
-
16
-
17
-
18
-
19
-
20
-
21
-
22
-
23
-
24
-
25
-
 26
26 -
 27
27 -
 28
28 -
 29
29 -
 30
30 -
 31
31 -
 32
32 -
 33
33 -
 34
34 -
 35
35 -
 36
36 -
 37
37 -
 38
38 -
 39
39 -
 40
40 -
 41
41 -
 42
42 -
 43
43 -
 44
44 -
 45
45 -
 46
46 -
47
-
48
-
49
-
50
-
51
-
52
-
53
-
54
-
55
-
56
-
57
-
58
-
59
-
60
-
61
-
62
-
63
-
64
-
65
-
66
-
67
-
68
-
69
-
70
-
71
-
72
-
73
-
74
-
75
-
76
-
77
-
78
-
79
-
80
-
81
-
82
-
83
-
84
-
85
-
86
-
87
-
88
-
89
-
90
-
91
-
92
-
93
-
94
-
95
-
96
-
97
-
98
-
99
-
100
-
101
-
102
-
103
-
104
-
105
-
106
-
107
-
108
-
109
-
110
-
111
-
112
-
113
-
114
-
115
-
116
-
117
-
118
-
119
-
120
-
121
-
122
-
123
-
124
-
125
-
126
-
127
-
128
-
129
-
130
-
131
-
132
-
133
-
134
-
135
-
136
-
137
-
138
-
139
-
140
-
141
-
142
-
143
-
144
 |
 |

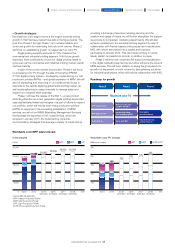
Business Overview
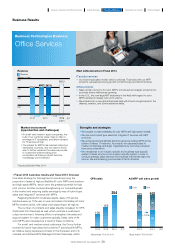
External revenue in this business
stood at ¥808.2 billion, up 10.5% year
on year, and operating profit was
¥72.6 billion, up 1.5% year on year.
An increase in gross profit in line with
an increase in sales of color units
centering on service provision
capabilities coupled with growth in
sales of digital printing systems and
the impact of the weak yen
contributed to higher sales and profit
in this segment.
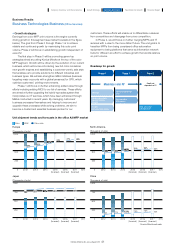
External revenue in this business
amounted to ¥78.5 billion, a decrease
of 4.6% year on year. Operating profit
was ¥2.1 billion, down 27.6% year on
year, due to a decrease in gross profit
in line with a decline in sales of local
procurements in Japan and significant
advance expenses related to the
launch of the diagnostic ultrasound
systems business.
Revenue decreased despite an increase
in sales in the performance materials
field compared with the previous year
due to falling demand in lenses for
compact cameras, downsizing of the
lens business for mobile phones and
withdrawal from the glass substrates for
HDDs business in the field of optical
systems for industrial use. Meanwhile,
an increase in sales in the performance
materials field and measuring
instruments field coupled with the effect
of a series of structural reforms
implemented in the previous fiscal year
in the field of optical systems for
industrial use contributed to an increase
in profit.
As a result, revenue of the Industrial
Business to external customers stood at
¥112.7 billion, down 2.9% year on year,
and operating profit was ¥19.7 billion, a
¥19.5 billion increase year on year.
*1 OP: Office Product *2 MIF (Machine in the Field): In the market for MFPs (multi-functional peripherals), production print machines, etc., it refers to the total installed base (number of working units).
*3 PV (Print Volume): The print output quantity *4 Multi-application: Applications of print technology to media other than paper, such as textiles and labels.
*5 MPM (Marketing Print Management): Service that offers print solutions optimized for customers’ marketing divisions. *6 PP: Production Print
80.6%
7.8%
11.2%
Business Results
Major gains were seen in
our core business,
the Business Technologies Business.
Business
Technologies
Business
Healthcare
Business
Industrial
Business
(Billions of yen)
(FY)
Revenue
1,000
750
500
250
0
2013 2014
(Billions of yen)
Operating profit
100
75
50
25
0
(FY)
2013 2014
739.9
66.6
71.5
731.3
(Billions of yen)
Revenue
100
50
0
82.3 82.3
(Billions of yen)
Operating profit
5
2.5
0
4.5
2.9
Revenue
150
100
50
0
116.1 116.1
(Billions of yen)
Operating profit
30
20
10
0
15.1
808.2
72.6
78.5
2.1
112.7
19.7
(Billions of yen)
IFRSJ-GAAP IFRSJ-GAAP IFRSJ-GAAP IFRSJ-GAAP
IFRSJ-GAAP IFRSJ-GAAP IFRSJ-GAAP
IFRSJ-GAAP IFRSJ-GAAP IFRSJ-GAAP
(Billions of yen)
R&D expense
60
45
30
15
0
(FY)
2013 2014
39.0 39.8
43.2
(Billions of yen)
Capital investment
40
30
20
10
0
(FY)
2013 2014
23.3 23.3
29.6
(FY)
2013 2014 (FY)
2013 2014
(Billions of yen)
R&D expense
6
3
0
4.0
5.3
3.9
(FY)
2013 2014
(FY)
2013 2014 (FY)
2013 2014
0.2
(Billions of yen)
R&D expense
15
10
5
0
12.5
(FY)
2013 2014
13.0
IFRSJ-GAAP
(Billions of yen)
Capital investment
15
10
5
0
2.7 2.6
(FY)
2013 2014
2.7
IFRSJ-GAAP
(Billions of yen)
Capital investment
20
10
0
13.3 13.3
6.7
(FY)
2013 2014
14.0
35
KONICA MINOLTA, INC. Annual Report 2015
Foundation for Growth
Business StrategiesGrowth StrategyCompany Overview and Characteristics Financial Report