Konica Minolta 2015 Annual Report Download - page 84
Download and view the complete annual report
Please find page 84 of the 2015 Konica Minolta annual report below. You can navigate through the pages in the report by either clicking on the pages listed below, or by using the keyword search tool below to find specific information within the annual report.-
 1
1 -
2
-
3
-
4
-
5
-
6
-
7
-
8
-
9
-
10
-
11
-
12
-
13
-
14
-
15
-
16
-
17
-
18
-
19
-
20
-
21
-
22
-
23
-
24
-
25
-
26
-
27
-
28
-
29
-
30
-
31
-
32
-
33
-
34
-
35
-
36
-
37
-
38
-
39
-
40
-
41
-
42
-
43
-
44
-
45
-
46
-
47
-
48
-
49
-
50
-
51
-
52
-
53
-
54
-
55
-
56
-
57
-
58
-
59
-
60
-
61
-
62
-
63
-
64
-
65
-
66
-
67
-
68
-
69
-
70
-
71
-
72
-
73
-
 74
74 -
 75
75 -
 76
76 -
 77
77 -
 78
78 -
 79
79 -
 80
80 -
 81
81 -
 82
82 -
 83
83 -
 84
84 -
 85
85 -
 86
86 -
 87
87 -
 88
88 -
 89
89 -
 90
90 -
 91
91 -
 92
92 -
 93
93 -
 94
94 -
95
-
96
-
97
-
98
-
99
-
100
-
101
-
102
-
103
-
104
-
105
-
106
-
107
-
108
-
109
-
110
-
111
-
112
-
113
-
114
-
115
-
116
-
117
-
118
-
119
-
120
-
121
-
122
-
123
-
124
-
125
-
126
-
127
-
128
-
129
-
130
-
131
-
132
-
133
-
134
-
135
-
136
-
137
-
138
-
139
-
140
-
141
-
142
-
143
-
144
 |
 |

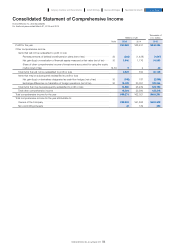
Consolidated Statement of Profit or Loss
Konica Minolta, Inc. and Subsidiaries
For the fiscal years ended March 31, 2015 and 2014
Millions of yen
Thousands of
U.S. dollars
Note 2015 2014 2015
Revenue ·························································································································································································································· 5,24 ¥1,002,758 ¥935,214 $8,344,495
Cost of sales ············································································································································································································ 27 513,084 490,479 4,269,651
Gross profit ······································································································································································································· 489,673 444,734 4,074,836
Other income ·········································································································································································································· 25 6,817 4,866 56,728
Selling, general and administrative expenses ································································································· 27 411,132 371,935 3,421,253
Other expenses ·································································································································································································· 26,27 19,595 37,806 163,061
Operating profit ·························································································································································································· 5 65,762 39,859 547,241
Finance income ·································································································································································································· 28 2,541 2,125 21,145
Finance costs ········································································································································································································· 28 2,848 3,084 23,700
Share of profit or loss of investments accounted for using the equity
method ······························································································································································································································ 14 35 (1,163) 291
Profit before tax ·································································································································································································· 65,491 37,736 544,986
Income tax expense ··················································································································································································· 16 24,521 9,305 204,053
Profit for the year ····················································································································································································· 40,969 28,431 340,925
Profit for the year attributable to:
Owners of the Company ··························································································································································· ¥ 40,934 ¥ 28,354 $ 340,634
Non-controlling interests ···························································································································································· 35 77 291
Yen U.S. dollars
Earnings per share ······················································································································································································ 29
Basic ····································································································································································································································· ¥ 81.01 ¥ 53.67 $ 674.13
Diluted ································································································································································································································· 80.79 53.54 672.30
83
KONICA MINOLTA, INC. Annual Report 2015
Foundation for GrowthBusiness StrategiesGrowth StrategyCompany Overview and Characteristics Financial Report