Konica Minolta 2015 Annual Report Download - page 85
Download and view the complete annual report
Please find page 85 of the 2015 Konica Minolta annual report below. You can navigate through the pages in the report by either clicking on the pages listed below, or by using the keyword search tool below to find specific information within the annual report.-
 1
1 -
2
-
3
-
4
-
5
-
6
-
7
-
8
-
9
-
10
-
11
-
12
-
13
-
14
-
15
-
16
-
17
-
18
-
19
-
20
-
21
-
22
-
23
-
24
-
25
-
26
-
27
-
28
-
29
-
30
-
31
-
32
-
33
-
34
-
35
-
36
-
37
-
38
-
39
-
40
-
41
-
42
-
43
-
44
-
45
-
46
-
47
-
48
-
49
-
50
-
51
-
52
-
53
-
54
-
55
-
56
-
57
-
58
-
59
-
60
-
61
-
62
-
63
-
64
-
65
-
66
-
67
-
68
-
69
-
70
-
71
-
72
-
73
-
74
-
 75
75 -
 76
76 -
 77
77 -
 78
78 -
 79
79 -
 80
80 -
 81
81 -
 82
82 -
 83
83 -
 84
84 -
 85
85 -
 86
86 -
 87
87 -
 88
88 -
 89
89 -
 90
90 -
 91
91 -
 92
92 -
 93
93 -
 94
94 -
 95
95 -
96
-
97
-
98
-
99
-
100
-
101
-
102
-
103
-
104
-
105
-
106
-
107
-
108
-
109
-
110
-
111
-
112
-
113
-
114
-
115
-
116
-
117
-
118
-
119
-
120
-
121
-
122
-
123
-
124
-
125
-
126
-
127
-
128
-
129
-
130
-
131
-
132
-
133
-
134
-
135
-
136
-
137
-
138
-
139
-
140
-
141
-
142
-
143
-
144
 |
 |

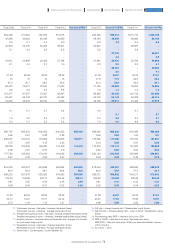
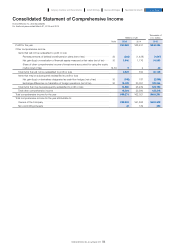
Consolidated Statement of Comprehensive Income
Konica Minolta, Inc. and Subsidiaries
For the fiscal years ended March 31, 2015 and 2014
Millions of yen
Thousands of
U.S. dollars
Note 2015 2014 2015
Profit for the year ·································································································································································································································································· ¥40,969 ¥28,431 $340,925
Other comprehensive income
Items that will not be reclassified to profit or loss
Remeasurements of defined benefit pension plans (net of tax) ·················································································· 30 (222) (1,428) (1,847)
Net gain (loss) on revaluation of financial assets measured at fair value (net of tax) ··············· 30 3,840 1,776 31,955
Share of other comprehensive income of investments accounted for using the equity
method (net of tax) ··································································································································································································································· 14,30 5 2 42
Total items that will not be reclassified to profit or loss ····························································································································· 3,623 350 30,149
Items that may be subsequently reclassified to profit or loss
Net gain (loss) on derivatives designated as cash flow hedges (net of tax) ··········································· 30 (348) 187 (2,896)
Exchange differences on translation of foreign operations (net of tax) ··························································· 30 15,029 23,051 125,064
Total items that may be subsequently reclassified to profit or loss ······················································································ 14,680 23,239 122,160
Total other comprehensive income ····························································································································································································· 18,304 23,590 152,318
Total comprehensive income for the year ················································································································································································· ¥59,274 ¥52,021 $493,251
Total comprehensive income for the year attributable to:
Owners of the Company ······························································································································································································································· ¥59,232 ¥51,892 $492,902
Non-controlling interests ································································································································································································································ 42 129 350
84
KONICA MINOLTA, INC. Annual Report 2015
Foundation for GrowthBusiness StrategiesGrowth StrategyCompany Overview and Characteristics Financial Report