Konica Minolta 2015 Annual Report Download - page 112
Download and view the complete annual report
Please find page 112 of the 2015 Konica Minolta annual report below. You can navigate through the pages in the report by either clicking on the pages listed below, or by using the keyword search tool below to find specific information within the annual report.-
 1
1 -
2
-
3
-
4
-
5
-
6
-
7
-
8
-
9
-
10
-
11
-
12
-
13
-
14
-
15
-
16
-
17
-
18
-
19
-
20
-
21
-
22
-
23
-
24
-
25
-
26
-
27
-
28
-
29
-
30
-
31
-
32
-
33
-
34
-
35
-
36
-
37
-
38
-
39
-
40
-
41
-
42
-
43
-
44
-
45
-
46
-
47
-
48
-
49
-
50
-
51
-
52
-
53
-
54
-
55
-
56
-
57
-
58
-
59
-
60
-
61
-
62
-
63
-
64
-
65
-
66
-
67
-
68
-
69
-
70
-
71
-
72
-
73
-
74
-
75
-
76
-
77
-
78
-
79
-
80
-
81
-
82
-
83
-
84
-
85
-
86
-
87
-
88
-
89
-
90
-
91
-
92
-
93
-
94
-
95
-
96
-
97
-
98
-
99
-
100
-
101
-
 102
102 -
 103
103 -
 104
104 -
 105
105 -
 106
106 -
 107
107 -
 108
108 -
 109
109 -
 110
110 -
 111
111 -
 112
112 -
 113
113 -
 114
114 -
 115
115 -
 116
116 -
 117
117 -
 118
118 -
 119
119 -
 120
120 -
 121
121 -
 122
122 -
123
-
124
-
125
-
126
-
127
-
128
-
129
-
130
-
131
-
132
-
133
-
134
-
135
-
136
-
137
-
138
-
139
-
140
-
141
-
142
-
143
-
144
 |
 |
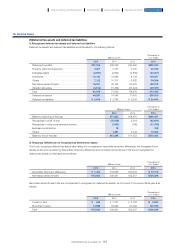
(2)Income tax expense
1) Income tax expense recognized in profit or loss
2) Income tax expense recognized in other comprehensive income
Income tax expense recognized in other comprehensive income is indicated in note 30 “Other Comprehensive Income”.
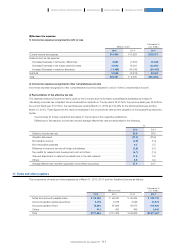
3) Reconciliation of the effective tax rate
The Japanese statutory income tax rate is used by the Company and its domestic consolidated subsidiaries as a basis for
calculating corporate tax, inhabitant tax and business tax deductions. The tax rate is 38.01% for the previous fiscal year, 35.64% for
the current fiscal year, 33.10% for the next fiscal year (ending March 31, 2016) and 32.34% for the following fiscal year (ending
March 31, 2017). These figures are the result of decreases in the corporate tax rate and the cessation of the Special Reconstruction
Surtax.
Income taxes for foreign operations are based on the tax laws of the respective jurisdictions.
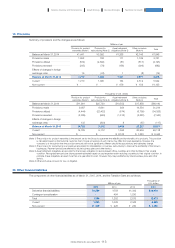
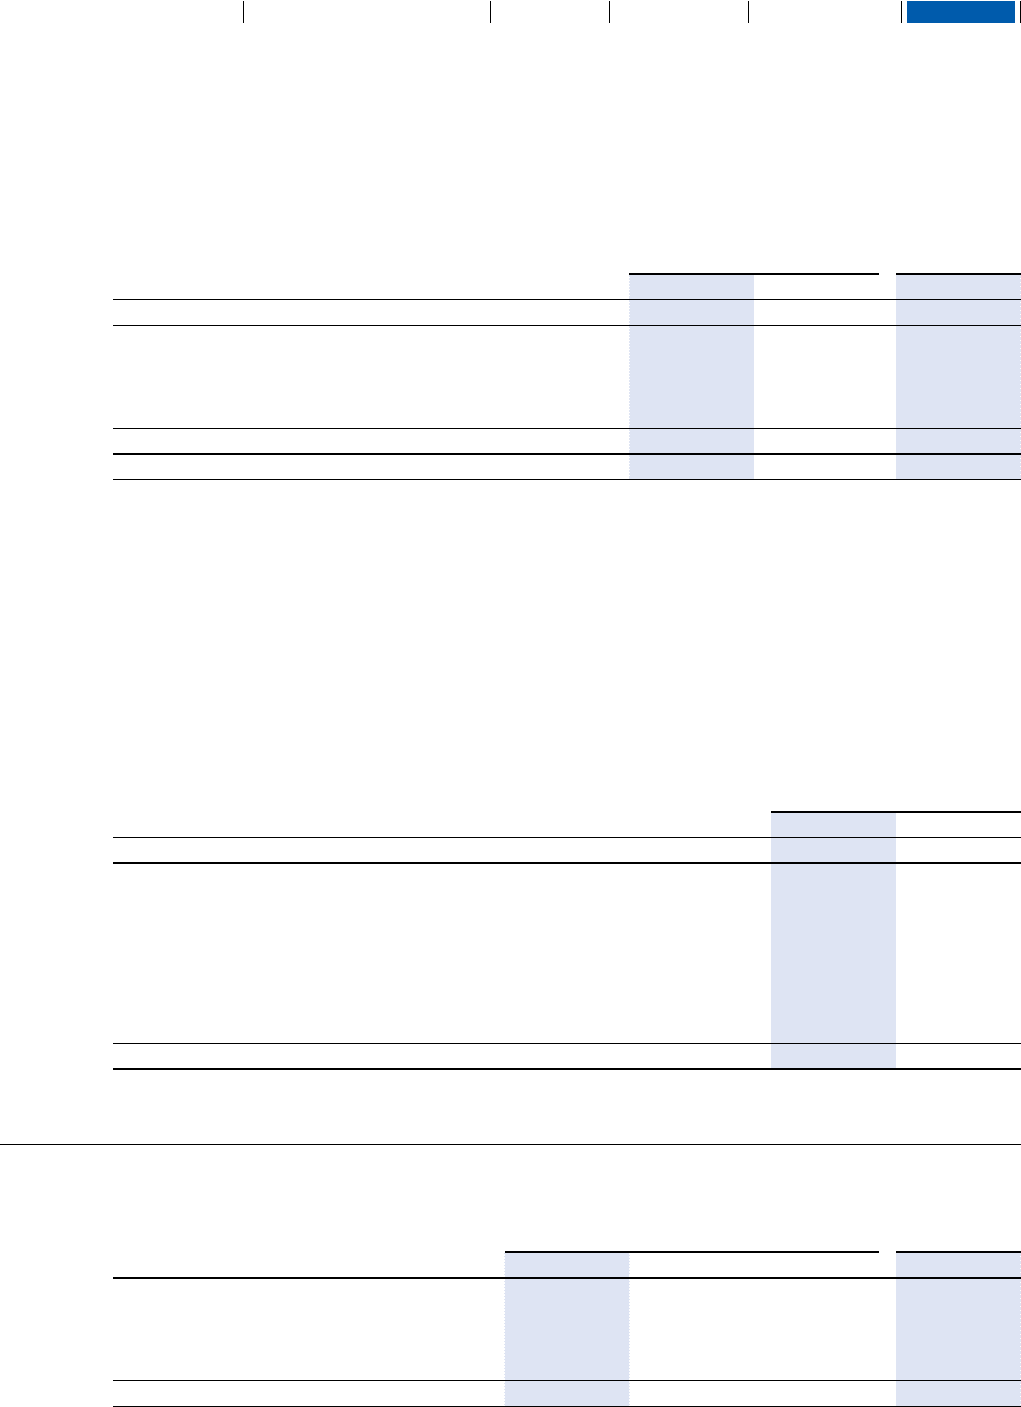
Differences in the statutory income tax rate and average effective tax rate are attributable to the following.
%
2015 2014
Statutory income tax rate ··································································································································································································································· 35.6 38.0
Valuation allowance ······················································································································································································································································ (10.3) (25.0)
Non-taxable revenue ·················································································································································································································································· (2.6) (1.4)
Non-deductible expenses ································································································································································································································· 4.3 2.5
Difference in statutory tax rate of foreign subsidiaries ······································································································································ (2.9) (3.1)
Tax credits for research and development cost and others ···················································································································· (4.7) (1.3)
Year-end adjustment to deferred tax assets due to tax rate revisions ·················································································· 11.6 5.0
Others ·································································································································································································································································································· 6.5 9.9
Average effective tax rate after application of tax effect accounting ························································································ 37.4 24.7
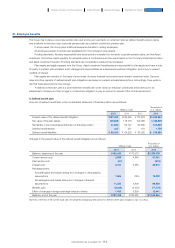
Millions of yen
Thousands of
U.S. dollars
2015 2014 2015
Current income tax expense ···························································································································································· ¥14,465 ¥11,624 $120,371
Deferred income tax expense
(Increase) Decrease in temporary differences ··························································································· 5,834 (7,367) 48,548
(Increase) Decrease in net losses carried forward ············································································· 15,690 15,091 130,565
Increase (Decrease) in valuation allowance ··································································································· (11,469) (10,042) (95,440)
Subtotal ································································································································································································································ 10,056 (2,318) 83,681
Total ············································································································································································································································ ¥24,521 ¥ 9,305 $204,053
Millions of yen
Thousands of
U.S. dollars
2015 2014 2013 2015
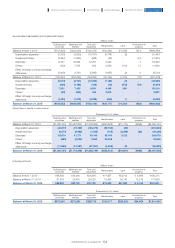
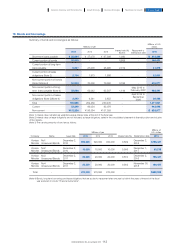
Notes and accounts payable-trade ····························································· ¥ 98,152 ¥ 96,240 ¥ 85,534 $ 816,776
Accounts payable-capital expenditure ··················································· 5,128 6,768 4,526 42,673
Accounts payable-others ······························································································ 73,868 67,898 56,075 614,696
Others ····························································································································································· 414 402 469 3,445
Total ···································································································································································· ¥177,564 ¥171,309 ¥146,605 $1,477,607
The components of trade and other payables as of March 31, 2015, 2014, and the Transition Date are as follows:
17. Trade and other payables
111
KONICA MINOLTA, INC. Annual Report 2015
Foundation for GrowthBusiness StrategiesGrowth StrategyCompany Overview and Characteristics Financial Report