Konica Minolta 2015 Annual Report Download - page 139
Download and view the complete annual report
Please find page 139 of the 2015 Konica Minolta annual report below. You can navigate through the pages in the report by either clicking on the pages listed below, or by using the keyword search tool below to find specific information within the annual report.-
 1
1 -
2
-
3
-
4
-
5
-
6
-
7
-
8
-
9
-
10
-
11
-
12
-
13
-
14
-
15
-
16
-
17
-
18
-
19
-
20
-
21
-
22
-
23
-
24
-
25
-
26
-
27
-
28
-
29
-
30
-
31
-
32
-
33
-
34
-
35
-
36
-
37
-
38
-
39
-
40
-
41
-
42
-
43
-
44
-
45
-
46
-
47
-
48
-
49
-
50
-
51
-
52
-
53
-
54
-
55
-
56
-
57
-
58
-
59
-
60
-
61
-
62
-
63
-
64
-
65
-
66
-
67
-
68
-
69
-
70
-
71
-
72
-
73
-
74
-
75
-
76
-
77
-
78
-
79
-
80
-
81
-
82
-
83
-
84
-
85
-
86
-
87
-
88
-
89
-
90
-
91
-
92
-
93
-
94
-
95
-
96
-
97
-
98
-
99
-
100
-
101
-
102
-
103
-
104
-
105
-
106
-
107
-
108
-
109
-
110
-
111
-
112
-
113
-
114
-
115
-
116
-
117
-
118
-
119
-
120
-
121
-
122
-
123
-
124
-
125
-
126
-
127
-
128
-
 129
129 -
 130
130 -
 131
131 -
 132
132 -
 133
133 -
 134
134 -
 135
135 -
 136
136 -
 137
137 -
 138
138 -
 139
139 -
 140
140 -
 141
141 -
 142
142 -
 143
143 -
 144
144
 |
 |

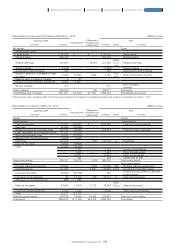
Reconciliation of total comprehensive income for the fiscal year March 31, 2014 (Millions of yen)
(Millions of yen)
Japanese GAAP Reclassification
Differences in
recognition and
measurement
IFRS
Accounts Amounts Amounts Notes Accounts
Net Sales ¥943,759 ¥ - (¥ 8,545) ¥935,214 L Revenue
Cost of sales 492,269 - (1,789) 490,479 A,G,J Cost of sales
Gross profit 451,490 - (6,755) 444,734 Gross profit
4,882 (15) 4,866 A Other income
Selling, general and administrative
expenses 393,346 - (21,410) 371,935 A,B,C,
G,J,L
Selling, general and administrative
expenses
37,533 273 37,806 A,I Other expenses
Operating income 58,144 (32,651) 14,365 39,859 Operating profit
Non-operating income 5,559 (5,559) -
Non-operating expenses 9,083 (9,083) -
Extraordinary income 1,524 (1,524) -
Extraordinary losses 32,642 (32,642) -
2,201 (75) 2,125 F Finance income
3,028 56 3,084 B,E,F Finance costs
(1,163) - (1,163) Share of profit of investments
accounted for using the equity method
Income before income taxes and minority
interests 23,503 - 14,233 37,736 Profit before tax
Income taxes–current 11,624 (11,624) -
Income taxes–deferred (10,060) 10,060 -
Total income taxes 1,564 - 7,741 9,305
A,B,E,
F,G,H,
I,J
Income tax expense
Income before minority interests 21,939 (21,939) -
Minority interests in income 77 (77) -
Net income 21,861 77 6,492 28,431 Profit for the year
Profit for the year attributable to:
21,861 6,492 28,354 Owners of the Company
¥ 77 ¥ - ¥ 77 Non-controlling interests
Japanese GAAP Reclassification
Differences in
recognition and
measurement
IFRS
Accounts Amounts Amounts Notes Accounts
Income before minority interests ¥21,939 ¥- ¥6,492 ¥28,431 Profit for the year
Other comprehensive income Other comprehensive income
Items that will not be reclassified to
profit or loss
(1,428) (1,428) G Remeasurements of defined benefit
pension plans (net of tax)
Valuation difference on available-for-sale
securities 1,738 - 37 1,776 F
Net gain (loss) on revaluation of
financial assets measured at fair
value (net of tax)
Share of other comprehensive income of
associates accounted for using equity
method
2 - 2
Share of other comprehensive
income of investments accounted
for using the equity method (net of
tax)
Items that may be subsequently
reclassified to profit or loss
Deferred gains or losses on hedges (40) - 228 187 F
Net gain (loss) on derivatives
designated as cash flow hedges
(net of tax)
Foreign currency translation adjustment 23,299 - (247) 23,051 C,D,E,
G,I
Exchange differences on translation
of foreign operations (net of tax)
Total other comprehensive income 25,000 - (1,410) 23,590 Total other comprehensive income
Comprehensive income 46,939 - 5,081 52,021 Total comprehensive income for the year
Comprehensive income attributable to
owners of the Company 46,810 - 5,081 51,892
Total comprehensive income for the year
attributable to:
Owners of the Company
Comprehensive income attributable to
minority interests ¥ 129 ¥- ¥ - ¥ 129 Non-controlling interests
(Note) Amounts under Japanese GAAP include the assets, liabilities and net assets of subsidiaries included in the scope for consolidation as of April 1, 2013.
138
KONICA MINOLTA, INC. Annual Report 2015
Foundation for GrowthBusiness StrategiesGrowth StrategyCompany Overview and Characteristics Financial Report