Konica Minolta 2015 Annual Report Download - page 103
Download and view the complete annual report
Please find page 103 of the 2015 Konica Minolta annual report below. You can navigate through the pages in the report by either clicking on the pages listed below, or by using the keyword search tool below to find specific information within the annual report.-
 1
1 -
2
-
3
-
4
-
5
-
6
-
7
-
8
-
9
-
10
-
11
-
12
-
13
-
14
-
15
-
16
-
17
-
18
-
19
-
20
-
21
-
22
-
23
-
24
-
25
-
26
-
27
-
28
-
29
-
30
-
31
-
32
-
33
-
34
-
35
-
36
-
37
-
38
-
39
-
40
-
41
-
42
-
43
-
44
-
45
-
46
-
47
-
48
-
49
-
50
-
51
-
52
-
53
-
54
-
55
-
56
-
57
-
58
-
59
-
60
-
61
-
62
-
63
-
64
-
65
-
66
-
67
-
68
-
69
-
70
-
71
-
72
-
73
-
74
-
75
-
76
-
77
-
78
-
79
-
80
-
81
-
82
-
83
-
84
-
85
-
86
-
87
-
88
-
89
-
90
-
91
-
92
-
 93
93 -
 94
94 -
 95
95 -
 96
96 -
 97
97 -
 98
98 -
 99
99 -
 100
100 -
 101
101 -
 102
102 -
 103
103 -
 104
104 -
 105
105 -
 106
106 -
 107
107 -
 108
108 -
 109
109 -
 110
110 -
 111
111 -
 112
112 -
 113
113 -
114
-
115
-
116
-
117
-
118
-
119
-
120
-
121
-
122
-
123
-
124
-
125
-
126
-
127
-
128
-
129
-
130
-
131
-
132
-
133
-
134
-
135
-
136
-
137
-
138
-
139
-
140
-
141
-
142
-
143
-
144
 |
 |
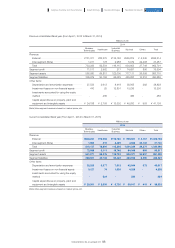
Millions of yen
Thousands of
U.S. dollars
2015 2014 2013 2015
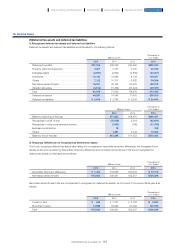
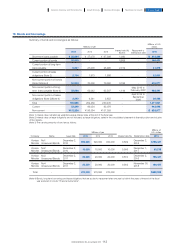
Merchandise and finished goods ·························································· ¥ 92,335 ¥ 87,700 ¥ 83,782 $ 768,370
Work in progress ··············································································································· 10,316 9,615 10,610 85,845
Materials and supplies (Note 1) ································································ 18,151 17,858 19,080 151,044
Total ························································································································································· ¥120,803 ¥115,175 ¥113,472 $1,005,268
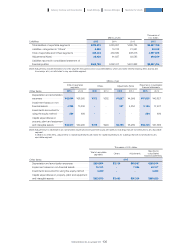
Millions of yen
Thousands of
U.S. dollars
2015 2014 2013 2015
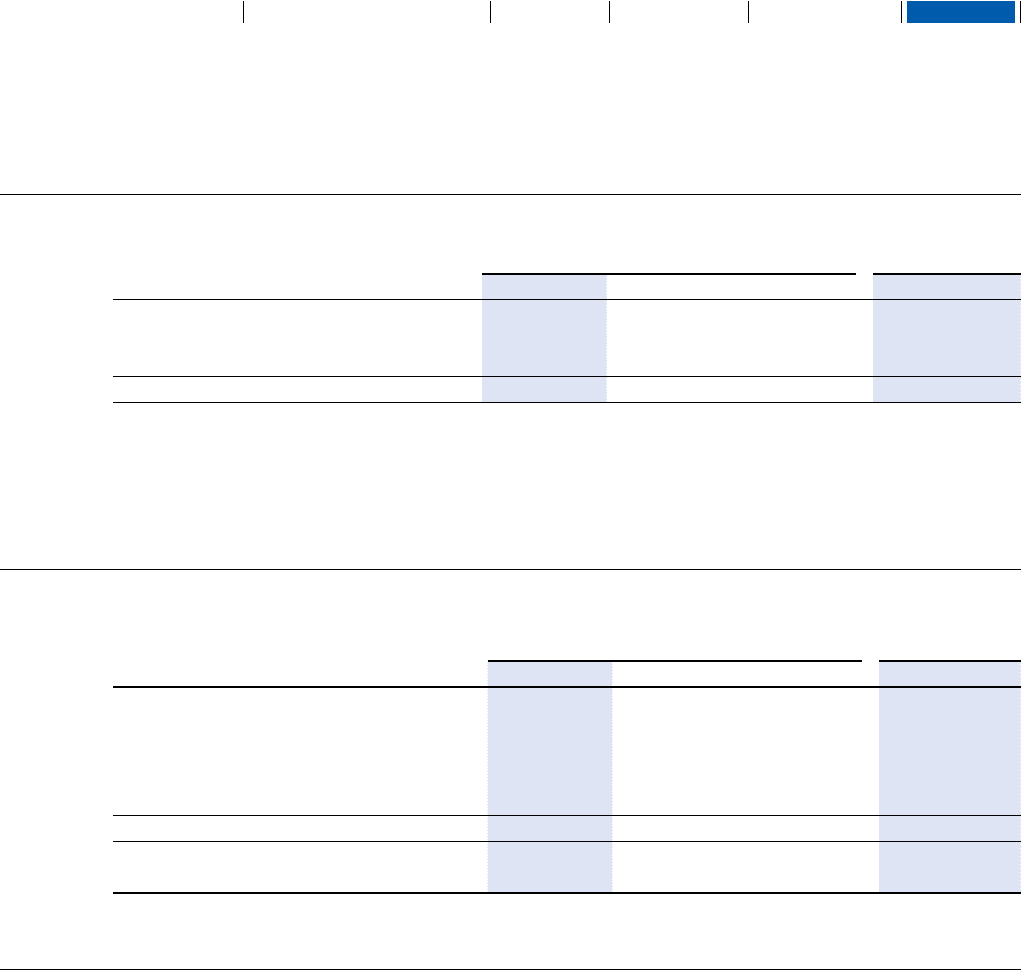
Loans receivable ··················································································································· ¥ 198 ¥ 1,189 ¥ 1,065 $ 1,648
Investment securities ···································································································· 30,534 27,621 20,325 254,090
Lease and guarantee deposits ···································································· 7,163 7,390 6,772 59,607
Others ····················································································································································· 6,093 4,370 4,106 50,703
Allowance for doubtful accounts ······························································ (853) (883) (1,366) (7,098)
Total ···························································································································································· 43,135 39,688 30,903 358,950
Current ················································································································································· 1,715 1,537 1,386 14,271
Non-current ··································································································································· ¥41,420 ¥38,151 ¥29,517 $344,678
(Note 1) Materials include spare parts for maintenance purpose to be used after 12 months from each fiscal year-end. They are included as inventories
as they are held within the ordinary course of business.
(Note 2) The acquisition costs of inventories recognized as expenses during the current fiscal year is primarily included in “cost of sales.”
(Note 3) The amount of inventories written down to their net realizable value in the current fiscal year is ¥1,546 million (previous fiscal year: ¥1,552
million), which is included in “cost of sales.”
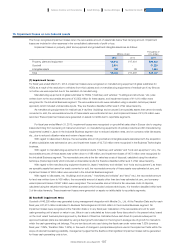
For fiscal year ended March 31, 2014, the board of directors of the Group resolved on October 31, 2013 to withdraw from the
manufacturing of glass substrates used for hard disk drives (HDDs), a constituent of the Industrial Business segment. Accordingly,
the Group presented this business as a non-current assets held for sale. Production ceased in November 2013, and sales were
suspended December 2013. The assets and liabilities of the business that were classified as non-current assets held for sale were
sold in June and July 2014. The value of the non-current assets held-for-sale, excluding selling costs, was measured at fair value,
recognizing ¥10,717 million in impairment losses. These impairment losses are recognized as “other expenses” in the consolidated
statements of profit or loss for the previous fiscal year. Fair value excluding selling costs was calculated using a valuation technique
(market approach), which included unobservable inputs. It is therefore classified within level 3 of fair value hierarchy.
For fiscal year ended March 31, 2015, in line with the mid-term management plan to improve asset efficiency, the Group
resolved to sell land, buildings, and other items in North America and Japan that are not attributable to reportable segments.
10. Non-current assets held-for-sale and disposal groups
The components of other financial assets as of March 31, 2015, 2014, and the Transition Date are as follows:
9. Other financial assets
The components of inventories as of March 31, 2015, 2014, and the Transition Date are as follows:
8. Inventories
102
KONICA MINOLTA, INC. Annual Report 2015
Foundation for GrowthBusiness StrategiesGrowth StrategyCompany Overview and Characteristics Financial Report