Konica Minolta 2015 Annual Report Download - page 42
Download and view the complete annual report
Please find page 42 of the 2015 Konica Minolta annual report below. You can navigate through the pages in the report by either clicking on the pages listed below, or by using the keyword search tool below to find specific information within the annual report.-
 1
1 -
2
-
3
-
4
-
5
-
6
-
7
-
8
-
9
-
10
-
11
-
12
-
13
-
14
-
15
-
16
-
17
-
18
-
19
-
20
-
21
-
22
-
23
-
24
-
25
-
26
-
27
-
28
-
29
-
30
-
31
-
 32
32 -
 33
33 -
 34
34 -
 35
35 -
 36
36 -
 37
37 -
 38
38 -
 39
39 -
 40
40 -
 41
41 -
 42
42 -
 43
43 -
 44
44 -
 45
45 -
 46
46 -
 47
47 -
 48
48 -
 49
49 -
 50
50 -
 51
51 -
 52
52 -
53
-
54
-
55
-
56
-
57
-
58
-
59
-
60
-
61
-
62
-
63
-
64
-
65
-
66
-
67
-
68
-
69
-
70
-
71
-
72
-
73
-
74
-
75
-
76
-
77
-
78
-
79
-
80
-
81
-
82
-
83
-
84
-
85
-
86
-
87
-
88
-
89
-
90
-
91
-
92
-
93
-
94
-
95
-
96
-
97
-
98
-
99
-
100
-
101
-
102
-
103
-
104
-
105
-
106
-
107
-
108
-
109
-
110
-
111
-
112
-
113
-
114
-
115
-
116
-
117
-
118
-
119
-
120
-
121
-
122
-
123
-
124
-
125
-
126
-
127
-
128
-
129
-
130
-
131
-
132
-
133
-
134
-
135
-
136
-
137
-
138
-
139
-
140
-
141
-
142
-
143
-
144
 |
 |

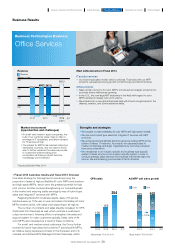
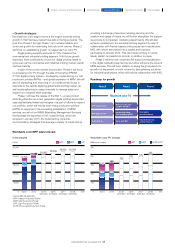
• Growth strategies
Earnings from color MFP print volume is the engine currently
driving growth in this segment (see market forecasts in the figure
below). The goal from Phase 0 through Phase 1 is to achieve
reliable and continued growth by maximizing this color print
volume. Phase 2 will focus on establishing growth independent of
color PV.
The first step in Phase 0 will be promoting genre-top
strategies aimed at putting Konica Minolta at the top of the color
MFP segment. Growth will be driven by the evolution of our current
business, which will involve introducing new A3 color models as
new growth engines and establishing a customer-centric sale style
that enables us to provide solutions for different industries and
business types. We will also strengthen GMA initiatives (business
targeting major accounts with a global presence) for OPS, which
optimize customers’ printing environments.
Phase 1 will focus on further enhancing added value through
efforts including adding MCS to our list of services. These efforts
are aimed at further upgrading the hybrid-type sales system that
incorporates our IT services, which have been enhanced through
M&As conducted in recent years. By managing customers’
business processes themselves and helping to improve and
upgrade these processes while solving problems, we aim to
become a trusted and essential business partner for our
Business Results
Business Technologies Business (Office Services)
customers. These efforts will enable us to differentiate ourselves
from competitors and disengage from price competition.
In Phase 2, we will focus on further merging MFPs and IT
services with a view to the more distant future. The end goal is to
transition MFPs from being considered office automation
equipment to being platforms that serve as information network
hubs for offices in an effort to achieve growth that avoids reliance
on print volume.
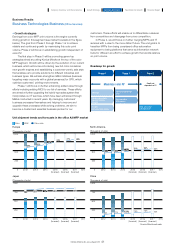
Roadmap for growth
Unit shipment trends and forecasts in the office A3 MFP market
Phase 0
OPS/GMA Penetrate hybrid-type
sales
Start providing
MCS globally
Solutions by industry
type and business
category
A3 color
next-generation engine
New-generation
office/platform
Phase 2Phase 1
Maximize color PV Growth not
dependent on PV
Japan
North America
Europe
China
(Thousands of units)
1,000
750
500
250
02012 2013 2014 2015
(forecast)
2016
(forecast)
2017
(forecast)
78%78% 80%
80% 81%
81% 81%81% 82%
82% 82%
82%
(Thousands of units)
1,000
750
500
250
02012 2013 2014 2015
(forecast)
2016
(forecast)
2017
(forecast)
43%43% 45%45% 46%
46% 51%
51% 53%
53% 55%
(Thousands of units)
1,000
750
500
250
02012 2013 2014 2015
(forecast)
2016
(forecast)
2017
(forecast)
59%59% 62%
62%
67%
67% 74%
74% 77%
77% 82%
82%
(Thousands of units)
1,000
750
500
250
02012 2013 2014 2015
(forecast)
2016
(forecast)
2017
(forecast)
9% 11% 12% 13% 15% 16%
(CY
)
(CY) (CY
)
(CY)
Color B/W Color ratio
* Konica Minolta estimate
41
KONICA MINOLTA, INC. Annual Report 2015
Foundation for GrowthBusiness StrategiesGrowth StrategyCompany Overview and Characteristics Financial Report