Konica Minolta 2015 Annual Report Download - page 100
Download and view the complete annual report
Please find page 100 of the 2015 Konica Minolta annual report below. You can navigate through the pages in the report by either clicking on the pages listed below, or by using the keyword search tool below to find specific information within the annual report.-
 1
1 -
2
-
3
-
4
-
5
-
6
-
7
-
8
-
9
-
10
-
11
-
12
-
13
-
14
-
15
-
16
-
17
-
18
-
19
-
20
-
21
-
22
-
23
-
24
-
25
-
26
-
27
-
28
-
29
-
30
-
31
-
32
-
33
-
34
-
35
-
36
-
37
-
38
-
39
-
40
-
41
-
42
-
43
-
44
-
45
-
46
-
47
-
48
-
49
-
50
-
51
-
52
-
53
-
54
-
55
-
56
-
57
-
58
-
59
-
60
-
61
-
62
-
63
-
64
-
65
-
66
-
67
-
68
-
69
-
70
-
71
-
72
-
73
-
74
-
75
-
76
-
77
-
78
-
79
-
80
-
81
-
82
-
83
-
84
-
85
-
86
-
87
-
88
-
89
-
 90
90 -
 91
91 -
 92
92 -
 93
93 -
 94
94 -
 95
95 -
 96
96 -
 97
97 -
 98
98 -
 99
99 -
 100
100 -
 101
101 -
 102
102 -
 103
103 -
 104
104 -
 105
105 -
 106
106 -
 107
107 -
 108
108 -
 109
109 -
 110
110 -
111
-
112
-
113
-
114
-
115
-
116
-
117
-
118
-
119
-
120
-
121
-
122
-
123
-
124
-
125
-
126
-
127
-
128
-
129
-
130
-
131
-
132
-
133
-
134
-
135
-
136
-
137
-
138
-
139
-
140
-
141
-
142
-
143
-
144
 |
 |

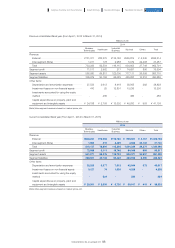
Thousands of U.S. dollars
2015
Business
Technologies Healthcare Industrial
Business Subtotal Others Total
Revenue
External ··········································································································································· $6,725,813 $653,807 $938,504 $8,318,141 $ 26,354 $8,344,495
Inter-segment ······················································································································· 15,769 2,630 20,180 38,579 192,253 230,840
Total ······················································································································································ 6,741,591 656,437 958,692 8,356,728 218,607 8,575,335
Segment profit ····························································································································· 604,876 17,567 164,334 786,785 8,064 794,849
Segment assets ························································································································ 5,336,365 544,029 996,280 6,876,683 207,514 7,084,206
Segment liabilities ·················································································································· 2,719,489 363,718 444,554 3,527,769 69,818 3,597,595
Other items
Depreciation and amortization expenses ····························· 268,395 28,102 58,359 354,864 3,104 357,968
Impairment losses on non-financial assets ······················· 26,021 616 8,538 35,183 - 35,183
Investments accounted for using the equity
method ············································································································································ - 4,360 - 4,360 - 4,360
Capital expenditures on property, plant and
equipment and intangible assets ······················································· $ 246,243 $ 21,678 $ 55,921 $ 323,850 $ 3,453 $ 327,311
(Note) Adjustments are due to inter-segment eliminations.
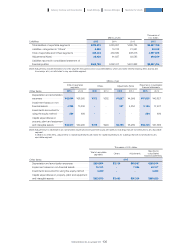
Millions of yen
Thousands of
U.S. dollars
Revenue 2015 2014 2015
Total revenue of reportable segments ···················································································································· ¥1,004,228 ¥934,953 $8,356,728
Revenue categorized in “Others” ···································································································································· 26,270 27,748 218,607
Total of reportable and Others segments ········································································································· 1,030,498 962,701 8,575,335
Adjustments (Note) ·················································································································································································· (27,740) (27,487) (230,840)
Revenue reported in consolidated statement of profit or loss ······································ ¥1,002,758 ¥935,214 $8,344,495
Millions of yen
Thousands of
U.S. dollars
Profit 2015 2014 2015
Total profit of reportable segments ······························································································································ ¥94,548 ¥74,697 $ 786,785
Segment profit categorized in “Others” ··············································································································· 969 806 8,064
Total of reportable and Others segments ········································································································· 95,517 75,504 794,849
Adjustments (Note) ·················································································································································································· (29,755) (35,645) (247,608)
Operating profit reported in consolidated statement of profit or loss ·············· ¥65,762 ¥39,859 $ 547,241
Millions of yen
Thousands of
U.S. dollars
Assets 2015 2014 2013 2015
Total assets of reportable segments ·························································· ¥826,371 ¥777,111 ¥701,284 $6,876,683
Assets categorized in “Others” ············································································ 24,937 26,598 43,654 207,514
Total of reportable and Others segments ·········································· 851,309 803,710 744,938 7,084,206
Adjustments (Note) ··················································································································· 142,946 181,528 213,500 1,189,531
Assets reported in consolidated statement of financial
position ························································································································································· ¥994,256 ¥985,239 ¥958,439 $8,273,746
(Note) Adjustments include eliminations for inter-segment transactions and corporate expenses, which are mainly general administration expenses and
basic research expenses not attributed to any reportable segment.
(Note) Adjustments include eliminations for inter-segment transactions and corporate assets that are not attributable to any reportable segment.
These corporate assets comprise operating funds (cash and cash deposits and securities), long-term investment funds (investment securities),
property, plant and equipment and intangible assets, etc.
Differences between totals for reportable segments and the financial information in the consolidated financial statements are
itemized and presented as below.
99
KONICA MINOLTA, INC. Annual Report 2015
Foundation for GrowthBusiness StrategiesGrowth StrategyCompany Overview and Characteristics Financial Report