Konica Minolta 2015 Annual Report Download - page 8
Download and view the complete annual report
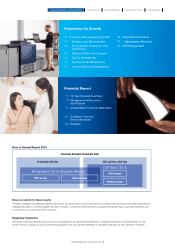
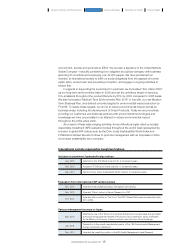
Please find page 8 of the 2015 Konica Minolta annual report below. You can navigate through the pages in the report by either clicking on the pages listed below, or by using the keyword search tool below to find specific information within the annual report.-
 1
1 -
 2
2 -
 3
3 -
 4
4 -
 5
5 -
 6
6 -
 7
7 -
 8
8 -
 9
9 -
 10
10 -
 11
11 -
 12
12 -
 13
13 -
 14
14 -
 15
15 -
 16
16 -
 17
17 -
 18
18 -
 19
19 -
20
-
21
-
22
-
23
-
24
-
25
-
26
-
27
-
28
-
29
-
30
-
31
-
32
-
33
-
34
-
35
-
36
-
37
-
38
-
39
-
40
-
41
-
42
-
43
-
44
-
45
-
46
-
47
-
48
-
49
-
50
-
51
-
52
-
53
-
54
-
55
-
56
-
57
-
58
-
59
-
60
-
61
-
62
-
63
-
64
-
65
-
66
-
67
-
68
-
69
-
70
-
71
-
72
-
73
-
74
-
75
-
76
-
77
-
78
-
79
-
80
-
81
-
82
-
83
-
84
-
85
-
86
-
87
-
88
-
89
-
90
-
91
-
92
-
93
-
94
-
95
-
96
-
97
-
98
-
99
-
100
-
101
-
102
-
103
-
104
-
105
-
106
-
107
-
108
-
109
-
110
-
111
-
112
-
113
-
114
-
115
-
116
-
117
-
118
-
119
-
120
-
121
-
122
-
123
-
124
-
125
-
126
-
127
-
128
-
129
-
130
-
131
-
132
-
133
-
134
-
135
-
136
-
137
-
138
-
139
-
140
-
141
-
142
-
143
-
144
 |
 |

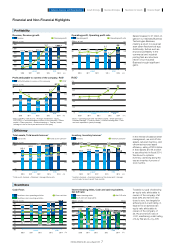
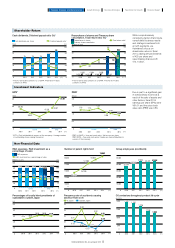
Financial and Non-Financial Highlights
(Billions of yen)
Revenue, Revenue growth
1,200
1,000
800
600
400
200
0
(%)
20
16
12
8
4
0
-4
2010 2011
813.0
2012 2013 2010 2011 2012 2013
2010 2011 2012 2013
(Billions of yen)
Operating profit, Operating profit ratio
80
60
40
20
0
40.0
5.1
40.3
5.3 5.0
(Billions of yen)
Profit attributable to owners of the company, ROE*
40
30
20
10
0
(%)
8.0
6.0
4.0
2.0
0
1.5
1.0
0.5
0
(%)
8.0
6.0
4.0
2.0
0
Total assets, Total assets turnover*
6.2
7.3
58.1
39.8
Operating profit
40.6
2010 2011 2012 2013
(%)
ROIC*
10.0
8.0
6.0
4.0
2.0
0
3.4
4.7
6.1
2014 (FY)
2014 (FY)
2014 (FY)
2014 (FY) 2014 (FY)
2014 (FY)
2014 (FY)
2014 (FY)
2010 2011 2012 2013
(Billions of yen) (times)
2010 2011 2012 20132010 2011 2012 2013
(Billions of yen)
Cash Flows
100
75
50
25
0
-25
-50
-75
-100
-42.7
72.3
67.9 66.4
-63.4
89.9
-55.7-54.1
(Billions of yen)
Interest-bearing debts, Cash and cash equivalents,
Net D/E ratio
300
250
200
150
100
50
0
(times)
0.08
0.06
0.04
0.02
0
-0.02
-0.04
224.9 213.9
227.9
Interest-bearing debts
Cash and cash equivalents
Cash flows from operating activities
Cash flows from investing activities
23.2 29.6
3.0
34.2 0.04
90.0
175.1
0.99
0.880.88
0.91
-3.3
-1.3
16.1
Profitability
Efficiency
Soundness
In the interest of balance sheet
management, we sold off idle
assets, reduced inventory, and
otherwise improved asset
efficiency, selling off ¥8.6 billion
in fixed assets and ¥3.2 billion
in securities held in fiscal 2014.
We strived to optimize
inventory, achieving along the
way an inventory turnover of
2.54 months.
Sales increased to ¥1 trillion on
gains in our mainstay Business
Technologies Business,
marking a return to a level last
seen seven fiscal periods ago.
Additionally, factors such as
improved profitability in the
commercial and industrial
printing field and structural
reform of our Industrial
Business brought significant
gains.
Towards our goal of achieving
an equity ratio attributable to
owners of the company of at
least 50% and net D/E ratio
close to zero, two targets for
achieving an A credit rating, in
fiscal 2014 we achieved an
equity ratio attributable to
owners of the company of
53.1% and net D/E ratio of
-0.02, maintaining a debt rating
of A by R&I and A+ by JCR.
5.1 5.2 5.2
2010 2011 2012 2013
(Billions of yen) (months)
Inventory, Inventory turnover*
150
100
50
0
3.0
2.0
1.0
0
100.2 105.0
2.67 2.60 2.52
2.81
943.7
5.9
Operating profit ratioRevenue Revenue growth
Inventory Inventory turnover*Total assets Total assets turnover*
Profit attributable to owners of the company ROE*
65.7
Net D/E ratioFree cash flow
101.9
-54.0
7.2
1,002.7
115.2
15.1
21.8
20.4
4.6
845.4
940.5
966.0 985.2 994.2
115.1 120.8
902.0
202.4 188.4
192.6 165.6 177.4
0.03
-0.01
1,000
800
600
0
28.4
40.9
25.8
196.1
188.4
231.9
J-GAAP IFRS
J-GAAP IFRS
J-GAAP IFRS
J-GAAP IFRS J-GAAP IFRS
J-GAAP IFRS
J-GAAP IFRS
J-GAAP IFRS
112.4
0.02
777.9 767.8
-44.7
6.1
8.7
5.0
8.3
0.96 1.01
2.82
2.54
35.9 48.0
0.03
-0.02
4.3
6.6
935.2
* ROE (J-GAAP) = Net income / Average shareholders’ equity
ROE (IFRS) = Profit attributable to owners of the company / (Share
capital + Share premium + Retained earnings + Treasury shares
(average at start of fiscal year and end of fiscal year))
* Total assets turnover = Revenue / Average total assets * Inventory turnover = Inventory balance at fiscal year end / Average
cost of sales for most recent three months
* ROIC = Operating profit after tax/(Share capital + Share premium +
Retained earnings + Treasury shares + Interest-bearing debt - Cash
and cash equivalents (yearly average))
7
KONICA MINOLTA, INC. Annual Report 2015 7
KONICA MINOLTA, INC. Annual Report 2015
Foundation for GrowthBusiness StrategiesGrowth StrategyCompany Overview and Characteristics Financial Report