Konica Minolta 2015 Annual Report Download - page 74
Download and view the complete annual report
Please find page 74 of the 2015 Konica Minolta annual report below. You can navigate through the pages in the report by either clicking on the pages listed below, or by using the keyword search tool below to find specific information within the annual report.-
 1
1 -
2
-
3
-
4
-
5
-
6
-
7
-
8
-
9
-
10
-
11
-
12
-
13
-
14
-
15
-
16
-
17
-
18
-
19
-
20
-
21
-
22
-
23
-
24
-
25
-
26
-
27
-
28
-
29
-
30
-
31
-
32
-
33
-
34
-
35
-
36
-
37
-
38
-
39
-
40
-
41
-
42
-
43
-
44
-
45
-
46
-
47
-
48
-
49
-
50
-
51
-
52
-
53
-
54
-
55
-
56
-
57
-
58
-
59
-
60
-
61
-
62
-
63
-
 64
64 -
 65
65 -
 66
66 -
 67
67 -
 68
68 -
 69
69 -
 70
70 -
 71
71 -
 72
72 -
 73
73 -
 74
74 -
 75
75 -
 76
76 -
 77
77 -
 78
78 -
 79
79 -
 80
80 -
 81
81 -
 82
82 -
 83
83 -
 84
84 -
85
-
86
-
87
-
88
-
89
-
90
-
91
-
92
-
93
-
94
-
95
-
96
-
97
-
98
-
99
-
100
-
101
-
102
-
103
-
104
-
105
-
106
-
107
-
108
-
109
-
110
-
111
-
112
-
113
-
114
-
115
-
116
-
117
-
118
-
119
-
120
-
121
-
122
-
123
-
124
-
125
-
126
-
127
-
128
-
129
-
130
-
131
-
132
-
133
-
134
-
135
-
136
-
137
-
138
-
139
-
140
-
141
-
142
-
143
-
144
 |
 |

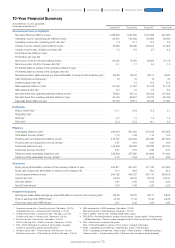
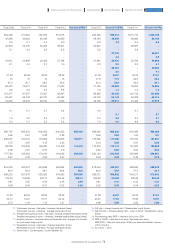
*1. Operating income ratio = Operating income / Net sales 100 (%)
Operating profit ratio = Operating profit / Revenue 100 (%)
*2. Ordinary income ratio = Ordinary income / Net sales 100 (%)
Ordinary profit ratio = Ordinary profit / Revenue 100 (%)
*3. Net income ratio = Net income / Net sales 100 (%)
Profit for the year ratio = Profit for the year / Revenue 100 (%)
*4. EPS = Profit attributable to owners of the company / Average
number of outstanding shares during the period
*5. Dividend payout ratio = Total dividends / Net income 100 (%)
Dividend payout ratio = Total dividends / Profit for the year 100 (%)
*6. R&D expense ratio = R&D expenses / Net sales 100 (%)
R&D expense ratio = R&D expenses / Revenue 100 (%)
*7. ROE (J-GAAP) = Net income / Average shareholders’ equity
*8. ROE (IFRS) = Profit attributable to owners of the company / (Share capital + Share premium
+ Retained earnings + Treasury shares (average at start of fiscal year and end of fiscal year))
*9. ROA = Net income / Average total assets
ROA = Profit attributable to owners of the company / Average total assets
*10. ROIC = Operating income after tax / (Shareholders’ equity + Net D/E ratio)
ROIC = Operating profit after tax / (Share capital + Share premium + Retained earnings +
Treasury shares + Interest-bearing debt - Cash and cash equivalents (yearly average))
Fiscal 2005 Fiscal 2006 Fiscal 2007 Fiscal 2008
Consolidated Financial Highlights
Net sales, Revenue (millions of yen) ························································································································································································· 1,068,390 1,027,630 1,071,568 947,843
Operating income, Operating profit (millions of yen) ···································································································································· 83,415 104,006 119,606 56,260
Operating income ratio, Operating profit ratio (%)*1 ····································································································································· 7.8 10.1 11.2 5.9
Ordinary income, Ordinary profit (millions of yen) ·············································································································································· 76,838 98,099 104,227 45,403
Ordinary income ratio, Ordinary profit ratio (%)*2 ··············································································································································· 7.2 9.5 9.7 4.8
Profit before tax (millions of yen) ····································································································································································································· - - - -
Profit before tax ratio (%) ····························································································································································································································· - - - -
Net income, Profit for the year (millions of yen) ···················································································································································· -54,305 72,542 68,829 15,179
Net income ratio, Profit for the year ratio (%)*3 ······················································································································································ -5.1 7.1 6.4 1.6
Profit attributable to owners of the company (millions of yen) ···································································································· - - - -
Profit attributable to owners of the company ratio (%) ···························································································································· - - - -
Earnings per share, Basic earnings per share attributable to owners of the company (yen)*4 ·· -102.29 136.67 129.71 28.62
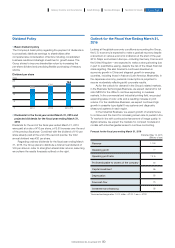
Cash dividends per share (yen) ········································································································································································································ 10 10 15 20
Dividend payout ratio (%)*5 ······················································································································································································································ - 7.3 11.6 70.0
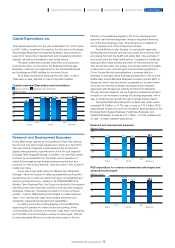
R&D expenses (millions of yen) ········································································································································································································ 67,039 71,961 81,272 81,778
R&D expense ratio (%)*6 ······························································································································································································································· 6.3 7.0 7.6 8.6
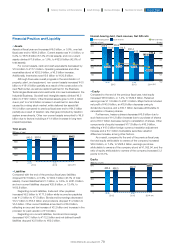
Net cash flows from operating activities (millions of yen) ···················································································································· 78,924 66,712 123,014 107,563
Net cash flows from investing activities (millions of yen) ······················································································································· -43,146 -56,401 -76,815 -90,169
Free cash flows (millions of yen) ····································································································································································································· 35,778 10,311 46,198 17,394
Profitability
ROE (J-GAAP) (%)*7 ············································································································································································································································· -17.1 21.9 17.5 3.7
ROE (IFRS) (%)*8 ························································································································································································································································ - - - -
ROA (%)*9 ·············································································································································································································································································· -5.7 7.7 7.2 1.6
ROIC (%)*10 ·········································································································································································································································································· 10.3 13.3 14.1 6.5
Efficiency
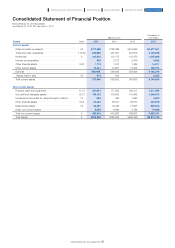
Total assets (millions of yen) ··················································································································································································································· 944,054 951,052 970,538 918,058
Total assets turnover (times)*11 ·········································································································································································································· 1.12 1.08 1.12 1.00
Property, plant and equipment (millions of yen) ··················································································································································· 216,127 230,094 245,989 227,860
Property, plant and equipment turnover (times)*12 ·········································································································································· 4.87 4.61 4.50 4.00
Inventories (millions of yen) ······················································································································································································································ 149,428 133,550 132,936 129,160
Inventories turnover (months)*13 ······································································································································································································ 3.41 3.19 2.96 3.21
Trade and other receivables (millions of yen) ···························································································································································· 246,264 257,380 234,862 171,835
Trade and other receivables turnover (times)*14 ··················································································································································· 2.75 2.94 2.76 2.56
Soundness
Equity, Equity attributable to owners of the company (millions of yen) ········································································ 293,817 367,467 417,166 413,380
Equity ratio, Equity ratio attributable to owners of the company (%) ·············································································· 31.1 38.6 43.0 45.0
Current assets (millions of yen) ········································································································································································································· 540,152 544,237 557,110 504,919
Current ratio (%)*15 ················································································································································································································································· 113.34 144.33 152.39 162.41
D/E ratio (times)*16 ··················································································································································································································································· 0.81 0.62 0.54 0.56
Net D/E ratio (times)*17 ···································································································································································································································· 0.53 0.39 0.25 0.23
Investment Indicators
Earnings per share, Basic earnings per share attributable to owners of the company (yen)*4 ······ -102.29 136.67 129.71 28.62
Price-to-earnings ratio (PER) (times)*18 ··············································································································································································· -14.68 11.33 10.44 29.28
Price-book value ratio (PBR) (times)*19 ················································································································································································ 0.37 0.45 0.58 0.93
10-Year Financial Summary
Konica Minolta, Inc. and subsidiaries
Fiscal year ended March 31
73
KONICA MINOLTA, INC. Annual Report 2015
Foundation for GrowthBusiness StrategiesGrowth StrategyCompany Overview and Characteristics Financial Report