Konica Minolta 2015 Annual Report Download - page 9
Download and view the complete annual report
Please find page 9 of the 2015 Konica Minolta annual report below. You can navigate through the pages in the report by either clicking on the pages listed below, or by using the keyword search tool below to find specific information within the annual report.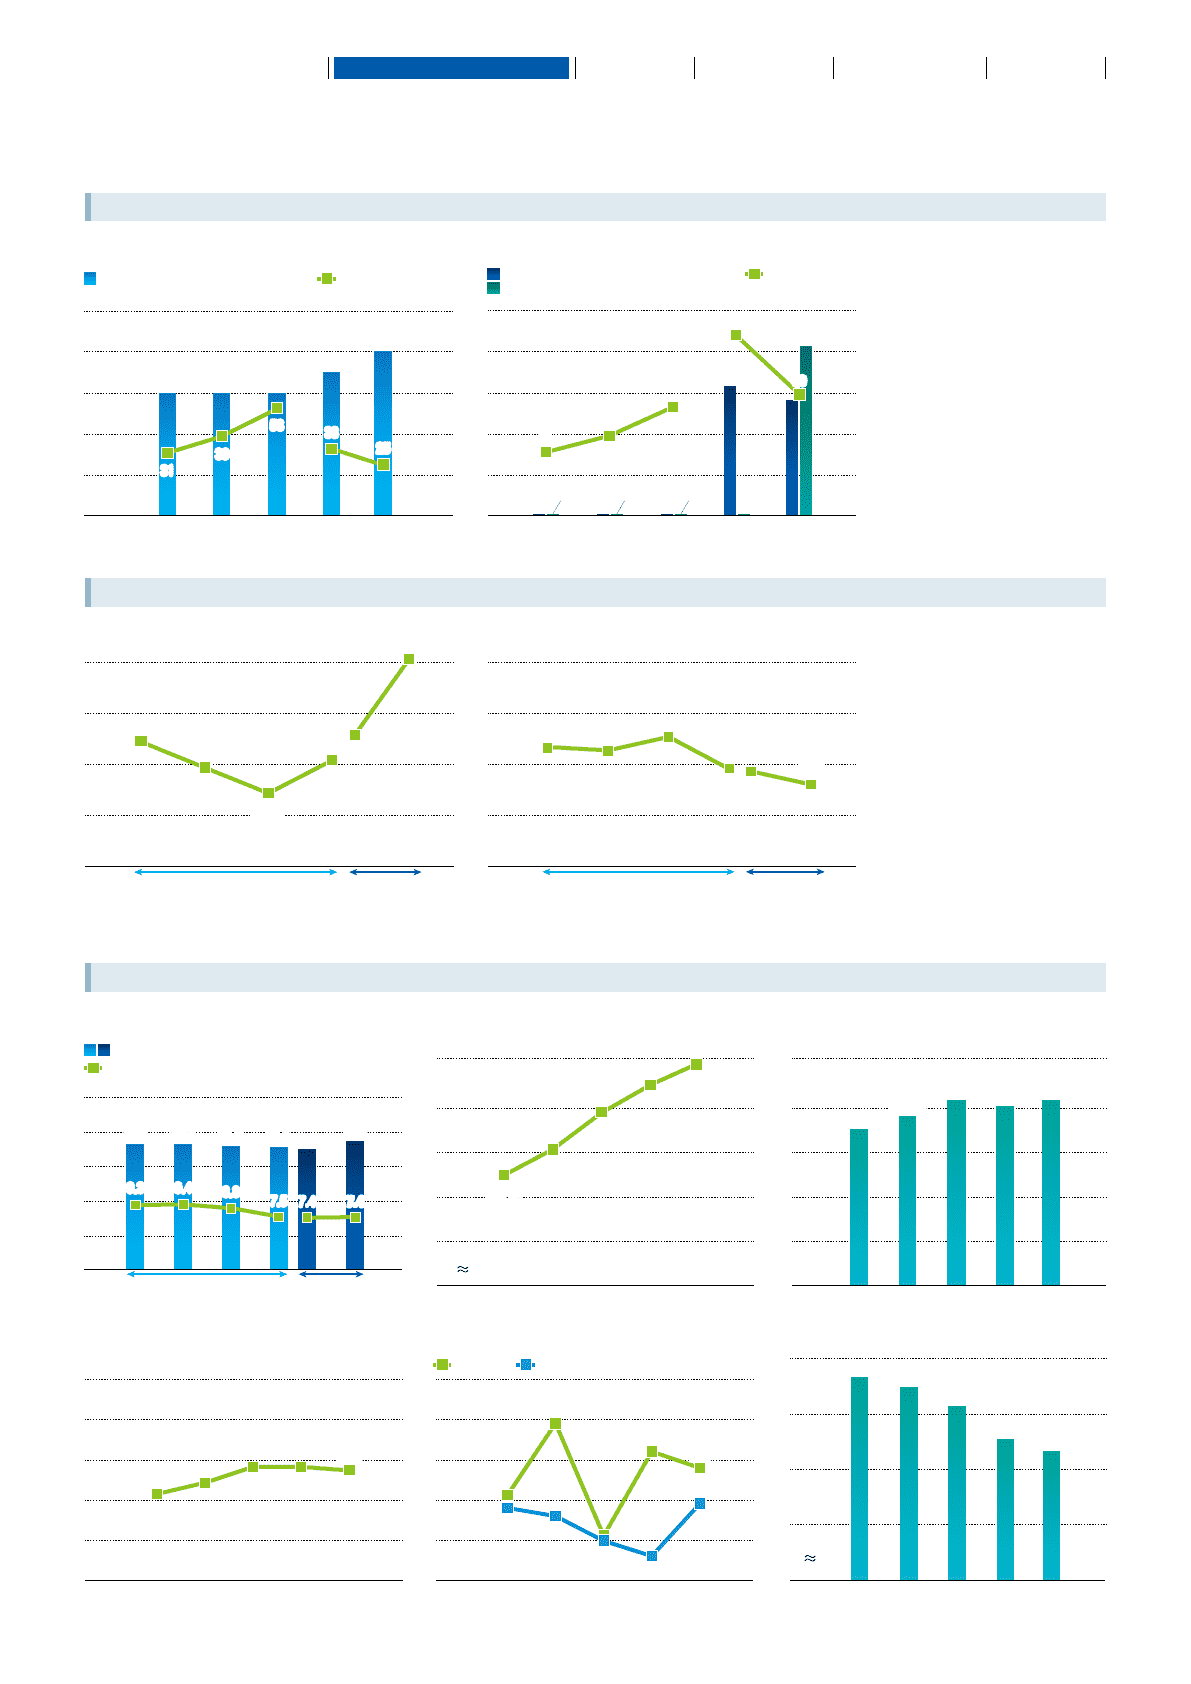
2010 2011 2012 2013
(Yen)
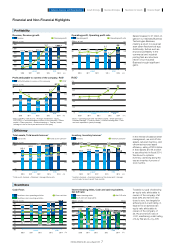
Cash dividends, Dividend payout ratio (%)*
25
20
15
10
5
0
(%)
100
80
60
40
20
0
15 15 15
17.5
20
33
53
39
31
Group employees (worldwide)
50,000
40,000
30,000
20,000
10,000
0
35,204
2010
38,206
2011
41,844
2012
40,401
2013
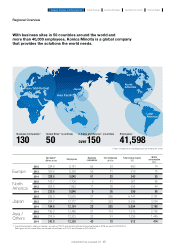
41,598
2010 2011 2012 2013 2010 2011 2012 2013
(%)
Percentages of locally hired presidents of
subsidiaries outside Japan
100
80
60
40
20
0
42.5 48.6
56.5 56.6 54.9
54.9
(kt-CO2)
CO2 emissions throughout product life cycle
1,400
1,200
1,000
800
0
1,331 1,295
1,226
1,108 1,063
(Yen)
EPS*
80
60
40
20
0
48.84
2010
38.52
2011
28.52
2012 2013
Repurchase of shares and Treasury share
cancellation, Total return ratio (%)*
Cash dividends per share
2010 2011 2012 2013
(%)
R&D expenses, R&D investment as a
percentage of sales
25.0
20.0
15.0
10.0
5.0
0
7.5
8.8
9.49.3
2014 (FY)
2014 (FY) 2014 (FY) 2014 (FY)
2014 (FY)
2014 (FY)
2014 (FY)
2014 (FY)
2014 (FY)
(Billions of yen)
100
80
60
40
20
0
72.6 72.5 71.5 71.1 69.6
(times)
PBR*
2.0
1.5
1.0
0.5
0
1.16
2010
1.13
0.99
0.96
2011
1.27
2012 2013
2010 2011 2012 2013
Frequency rate of accidents causing
absence from work
0.5
0.4
0.3
0.2
0.1
0
0.21
0.39
0.11
0.32
0.28
0.18 0.16
0.10
0.06
0.19
2010 2011 2012 2013
Number of patent rights held
20,000
17,500
15,000
12,500
10,000
0
18,847
19,962
0.86
17,285
15,199
13,724
Shareholder Return
Non-Financial Data
Investment Indicators
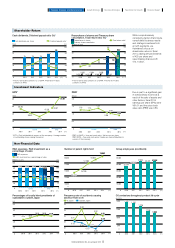
While comprehensively
considering factors that include
consolidated business results
and strategic investment into
growth segments, we
maintained a focus on
shareholder return in fiscal
2014, paying annual dividends
of ¥20 per share and
repurchasing shares worth
¥14.1 billion.
Due in part to a significant gain
in extraordinary income as a
result of the sale of assets and
other factors, fiscal 2014
earnings per share (EPS) were
¥81.01 and the price-book
value ratio (PBR) was 0.86.
Dividend payout ratio*
R&D expenses
R&D investment as a percentage of sales
74.2
In Japan Outside Japan
25
41.38
J-GAAP IFRS
J-GAAP IFRS J-GAAP IFRS
7.4 7.4
53.67
81.01
* FY2010-2012 data conforms to J-GAAP; FY2013-2014 data
conforms to IFRS
* FY2010-2012 data conforms to J-GAAP; FY2013-2014 data
conforms to IFRS
* PBR (J-GAAP) = Year-end stock price / Net assets per share
PBR (IFRS) = Year-end stock price / Equity per share attributable to
owners of the company
* EPS = Profit attributable to owners of the company / Average number
of outstanding shares during the period
2014 (FY)
2010 2011 2012 2013
(Billions of yen)
25
20
15
10
5
0
(%)
100
80
60
40
20
0
Repurchase of shares
Treasury share cancellation
31
Total return ratio*
0.02
14.1
20.7
53
39
0.076 0.148 0.011 0.084 0.058
0.009
88
15.8
59
8
KONICA MINOLTA, INC. Annual Report 2015 8
KONICA MINOLTA, INC. Annual Report 2015
Foundation for GrowthBusiness StrategiesGrowth StrategyCompany Overview and Characteristics Financial Report

