Konica Minolta 2015 Annual Report Download - page 82
Download and view the complete annual report
Please find page 82 of the 2015 Konica Minolta annual report below. You can navigate through the pages in the report by either clicking on the pages listed below, or by using the keyword search tool below to find specific information within the annual report.-
 1
1 -
2
-
3
-
4
-
5
-
6
-
7
-
8
-
9
-
10
-
11
-
12
-
13
-
14
-
15
-
16
-
17
-
18
-
19
-
20
-
21
-
22
-
23
-
24
-
25
-
26
-
27
-
28
-
29
-
30
-
31
-
32
-
33
-
34
-
35
-
36
-
37
-
38
-
39
-
40
-
41
-
42
-
43
-
44
-
45
-
46
-
47
-
48
-
49
-
50
-
51
-
52
-
53
-
54
-
55
-
56
-
57
-
58
-
59
-
60
-
61
-
62
-
63
-
64
-
65
-
66
-
67
-
68
-
69
-
70
-
71
-
 72
72 -
 73
73 -
 74
74 -
 75
75 -
 76
76 -
 77
77 -
 78
78 -
 79
79 -
 80
80 -
 81
81 -
 82
82 -
 83
83 -
 84
84 -
 85
85 -
 86
86 -
 87
87 -
 88
88 -
 89
89 -
 90
90 -
 91
91 -
 92
92 -
93
-
94
-
95
-
96
-
97
-
98
-
99
-
100
-
101
-
102
-
103
-
104
-
105
-
106
-
107
-
108
-
109
-
110
-
111
-
112
-
113
-
114
-
115
-
116
-
117
-
118
-
119
-
120
-
121
-
122
-
123
-
124
-
125
-
126
-
127
-
128
-
129
-
130
-
131
-
132
-
133
-
134
-
135
-
136
-
137
-
138
-
139
-
140
-
141
-
142
-
143
-
144
 |
 |
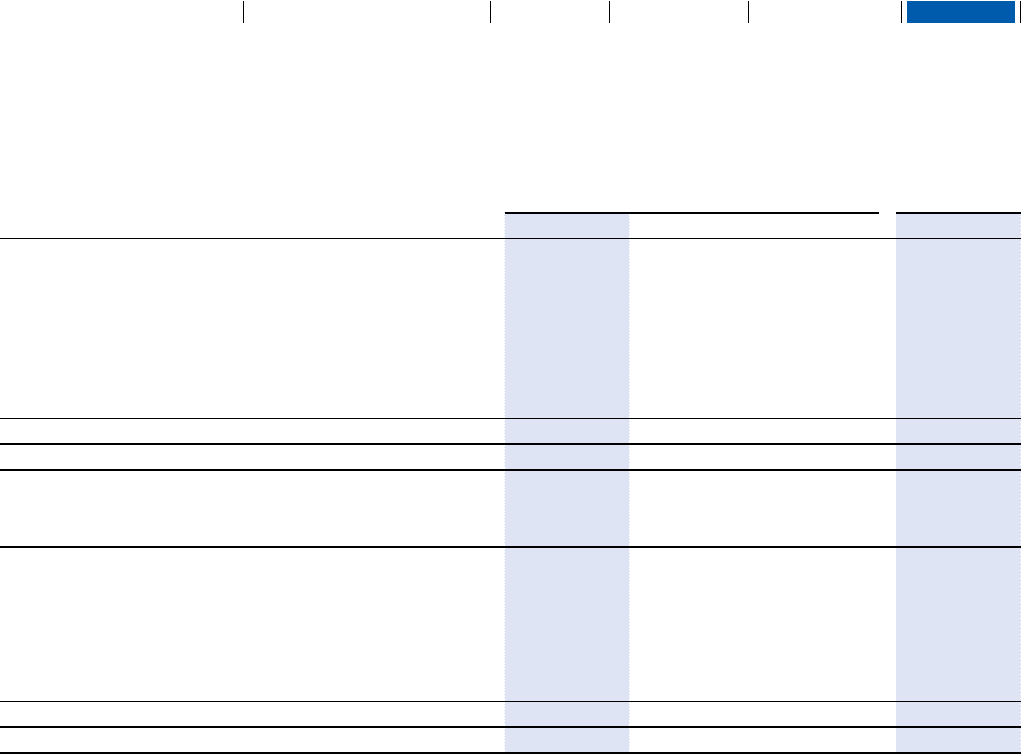
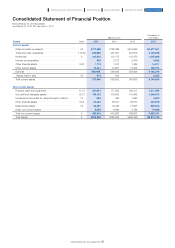
Consolidated Statement of Financial Position
Konica Minolta, Inc. and Subsidiaries
As of March 31, 2015, 2014 and April 1, 2013
Millions of yen
Thousands of
U.S. dollars
Assets Note 2015 2014 2013 2015
Current assets
Cash and cash equivalents ··············································································································· 32 ¥177,496 ¥188,489 ¥214,556 $1,477,041
Trade and other receivables ············································································································· 7,15,32 252,962 247,067 214,616 2,105,035
Inventories ······································································································································································ 8 120,803 115,175 113,472 1,005,268
Income tax receivables ····························································································································· 559 2,727 2,470 4,652
Other financial assets ·································································································································· 9,32 1,715 1,537 1,386 14,271
Other current assets ····································································································································· 16,431 13,961 13,304 136,731
Subtotal ··············································································································································································· 569,968 568,958 559,806 4,743,014
Assets held for sale ······································································································································ 10 672 594 - 5,592
Total current assets ········································································································································· 570,640 569,552 559,806 4,748,606
Non-current assets
Property, plant and equipment ···································································································· 11,13 181,641 177,056 180,311 1,511,534
Goodwill and intangible assets ··································································································· 12,13 126,132 119,563 110,942 1,049,613
Investments accounted for using the equity method ··························· 14 524 486 1,490 4,360
Other financial assets ·································································································································· 9,32 41,420 38,151 29,517 344,678
Deferred tax assets ········································································································································· 16 64,291 74,348 71,605 535,000
Other non-current assets ····················································································································· 9,605 6,080 4,764 79,928
Total non-current assets ························································································································· 5 423,615 415,687 398,632 3,525,131
Total assets ··································································································································································· 5¥994,256 ¥985,239 ¥958,439 $8,273,746
81
KONICA MINOLTA, INC. Annual Report 2015
Foundation for GrowthBusiness StrategiesGrowth StrategyCompany Overview and Characteristics Financial Report