Konica Minolta 2015 Annual Report Download - page 83
Download and view the complete annual report
Please find page 83 of the 2015 Konica Minolta annual report below. You can navigate through the pages in the report by either clicking on the pages listed below, or by using the keyword search tool below to find specific information within the annual report.-
 1
1 -
2
-
3
-
4
-
5
-
6
-
7
-
8
-
9
-
10
-
11
-
12
-
13
-
14
-
15
-
16
-
17
-
18
-
19
-
20
-
21
-
22
-
23
-
24
-
25
-
26
-
27
-
28
-
29
-
30
-
31
-
32
-
33
-
34
-
35
-
36
-
37
-
38
-
39
-
40
-
41
-
42
-
43
-
44
-
45
-
46
-
47
-
48
-
49
-
50
-
51
-
52
-
53
-
54
-
55
-
56
-
57
-
58
-
59
-
60
-
61
-
62
-
63
-
64
-
65
-
66
-
67
-
68
-
69
-
70
-
71
-
72
-
 73
73 -
 74
74 -
 75
75 -
 76
76 -
 77
77 -
 78
78 -
 79
79 -
 80
80 -
 81
81 -
 82
82 -
 83
83 -
 84
84 -
 85
85 -
 86
86 -
 87
87 -
 88
88 -
 89
89 -
 90
90 -
 91
91 -
 92
92 -
 93
93 -
94
-
95
-
96
-
97
-
98
-
99
-
100
-
101
-
102
-
103
-
104
-
105
-
106
-
107
-
108
-
109
-
110
-
111
-
112
-
113
-
114
-
115
-
116
-
117
-
118
-
119
-
120
-
121
-
122
-
123
-
124
-
125
-
126
-
127
-
128
-
129
-
130
-
131
-
132
-
133
-
134
-
135
-
136
-
137
-
138
-
139
-
140
-
141
-
142
-
143
-
144
 |
 |

Millions of yen
Thousands of
U.S. dollars
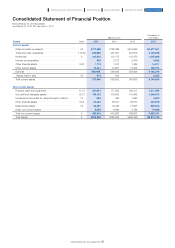
Liabilities Note 2015 2014 2013 2015
Current liabilities
Trade and other payables ···················································································································· 17,32 ¥177,564 ¥171,309 ¥146,605 $1,477,607
Bonds and borrowings ····························································································································· 15,18,32 53,349 66,054 93,076 443,946
Income tax payables ···································································································································· 7,522 6,238 7,934 62,595
Provisions ········································································································································································ 19 5,542 6,787 4,212 46,118
Other financial liabilities ···························································································································· 20,32 1,020 1,026 2,342 8,488
Other current liabilities ································································································································ 36,889 32,178 28,360 306,973
Total current liabilities ··································································································································· 281,889 283,595 282,530 2,345,752
Non-current liabilities
Bonds and borrowings ····························································································································· 15,18,32 112,236 136,384 137,359 933,977
Retirement benefit liabilities ··············································································································· 21 62,039 64,928 65,082 516,260
Provisions ········································································································································································ 19 1,135 1,161 1,136 9,445
Other financial liabilities ···························································································································· 20,32 539 226 230 4,485
Deferred tax liabilities ··································································································································· 16 2,944 2,794 2,634 24,499
Other non-current liabilities ················································································································ 3,967 3,327 2,888 33,012
Total non-current liabilities ··················································································································· 182,863 208,821 209,331 1,521,703
Total liabilities ····························································································································································· 5 464,752 492,417 491,862 3,867,454
Equity
Share capital ······························································································································································· 22 37,519 37,519 37,519 312,216
Share premium ······················································································································································· 22 203,395 203,421 204,140 1,692,561
Retained earnings ············································································································································· 22 251,323 239,453 221,802 2,091,396
Treasury shares ······················································································································································ 22 (10,727) (17,322) (1,548) (89,265)
Subscription rights to shares ········································································································· 31 1,016 910 764 8,455
Other components of equity ··········································································································· 22 45,905 28,100 3,150 382,000
Equity attributable to owners of the Company ················································ 528,432 492,081 465,830 4,397,370
Non-controlling interests ························································································································ 1,071 740 747 8,912
Total equity ····································································································································································· 529,504 492,822 466,577 4,406,291
Total liabilities and equity ······················································································································· ¥994,256 ¥985,239 ¥958,439 $8,273,746
82
KONICA MINOLTA, INC. Annual Report 2015
Foundation for GrowthBusiness StrategiesGrowth StrategyCompany Overview and Characteristics Financial Report