Konica Minolta 2015 Annual Report Download - page 128
Download and view the complete annual report
Please find page 128 of the 2015 Konica Minolta annual report below. You can navigate through the pages in the report by either clicking on the pages listed below, or by using the keyword search tool below to find specific information within the annual report.-
 1
1 -
2
-
3
-
4
-
5
-
6
-
7
-
8
-
9
-
10
-
11
-
12
-
13
-
14
-
15
-
16
-
17
-
18
-
19
-
20
-
21
-
22
-
23
-
24
-
25
-
26
-
27
-
28
-
29
-
30
-
31
-
32
-
33
-
34
-
35
-
36
-
37
-
38
-
39
-
40
-
41
-
42
-
43
-
44
-
45
-
46
-
47
-
48
-
49
-
50
-
51
-
52
-
53
-
54
-
55
-
56
-
57
-
58
-
59
-
60
-
61
-
62
-
63
-
64
-
65
-
66
-
67
-
68
-
69
-
70
-
71
-
72
-
73
-
74
-
75
-
76
-
77
-
78
-
79
-
80
-
81
-
82
-
83
-
84
-
85
-
86
-
87
-
88
-
89
-
90
-
91
-
92
-
93
-
94
-
95
-
96
-
97
-
98
-
99
-
100
-
101
-
102
-
103
-
104
-
105
-
106
-
107
-
108
-
109
-
110
-
111
-
112
-
113
-
114
-
115
-
116
-
117
-
 118
118 -
 119
119 -
 120
120 -
 121
121 -
 122
122 -
 123
123 -
 124
124 -
 125
125 -
 126
126 -
 127
127 -
 128
128 -
 129
129 -
 130
130 -
 131
131 -
 132
132 -
 133
133 -
 134
134 -
 135
135 -
 136
136 -
 137
137 -
 138
138 -
139
-
140
-
141
-
142
-
143
-
144
 |
 |

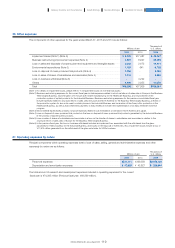
3) Market risks (foreign exchange, share price and interest rate fluctuation risks)
(a) Foreign exchange fluctuation risk
As part of developing its global business, the Group has foreign currency receivables and payables, which are subject to foreign
exchange fluctuation risk. To manage this risk, the Group determines its foreign exchange fluctuation risk in each currency every
month and, in principle, hedges this risk by using forward exchange transactions and currency option transactions. Depending
on foreign exchange market conditions, the Group may also enter into forward exchange contracts and currency option
transactions on foreign currency receivables and payables for expected transactions it deems certain to occur.
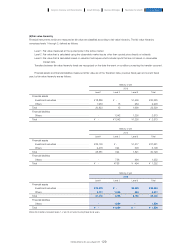
Foreign exchange sensitivity analysis
The table below shows the impact on profit before tax in the consolidated statement of profit or loss of a 1% change in value of
the U.S.dollar, the euro and the pound sterling against the yen due to its holdings of foreign currency receivables and payables
at the end of each fiscal year. In making these calculations, the Group has assumed no changes in currencies other than those
used.
As of March 31, 2015
As of March 31, 2015
Millions of yen
Thousands of
U.S. dollars
2015 2014 2015
U.S. dollar ················································································································································································································ ¥246 ¥127 $2,047
Euro ···································································································································································································································· (9) (17) (75)
Pound sterling ·································································································································································································· ¥ 17 ¥ 67 $ 141
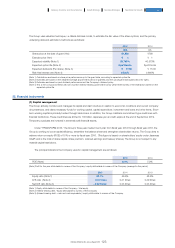
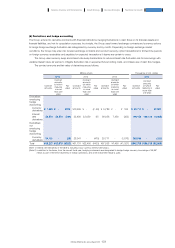
Millions of yen
Carrying
amounts
Contractual
cash flows
Less than
1 year
More than
1 year, less
than 2 years
More than
2 years, less
than 3 years
More than
3 years, less
than 4 years
More than
4 years, less
than 5 years
More than
5 years
Long-term loans payable ············· ¥ 63,697 ¥ 63,697 ¥ 5,001 ¥ 4,001 ¥ 9,000 ¥ 3,000 ¥5,500 ¥37,193
Bonds ············································································ 70,000 70,000 20,000 20,000 10,000 20,000 - -
Lease obligations ······································· 6,244 6,244 2,704 1,818 1,012 487 109 111
Others ··········································································· 1,559 1,559 1,020 - - - - 539
Total ·················································································· ¥141,501 ¥141,501 ¥28,725 ¥25,820 ¥20,013 ¥23,488 ¥5,610 ¥37,844
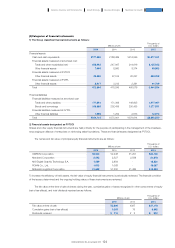
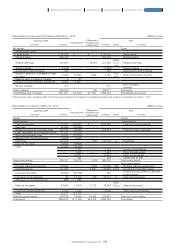
Thousands of U.S. dollars
Carrying
amounts
Contractual
cash flows
Less than
1 year
More than
1 year, less
than 2 years
More than
2 years, less
than 3 years
More than
3 years, less
than 4 years
More than
4 years, less
than 5 years
More than
5 years
Long-term loans payable ············· $ 530,057 $ 530,057 $ 41,616 $ 33,294 $ 74,894 $ 24,965 $45,768 $309,503
Bonds ············································································ 582,508 582,508 166,431 166,431 83,215 166,431 - -
Lease obligations ······································· 51,960 51,960 22,501 15,129 8,421 4,053 907 924
Others ··········································································· 12,973 12,973 8,488 - - - - 4,485
Total ·················································································· $1,177,507 $1,177,507 $239,036 $214,862 $166,539 $195,456 $46,684 $314,921
(b) Share price fluctuation risk
The Group holds shares in other listed companies in the interest of cultivating business relationships, and these equity financial
instruments are subject to share price fluctuation risk. Equity financial instruments are held to ensure the smooth operation of
business strategies by participating in the management of the investees, encouraging an alliance of enterprises or reinforcing
sales foundations, and not for earning investment returns through sales. With regard to equity financial instruments, the Group
regularly monitors share prices and checks the issuing entity’s financial condition.
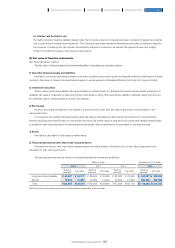
Share price fluctuation sensitivity analysis
In the sensitivity analysis below, the Group calculates sensitivity based on the price risk on equity financial instruments at the
end of the fiscal year. A 1% increase or decrease in share prices had a ¥261 million impact on cumulative other comprehensive
income (net of taxes) as of the end of the previous fiscal year. As of the end of the current fiscal year, the sensitivity was a 283
million.
127
KONICA MINOLTA, INC. Annual Report 2015
Foundation for GrowthBusiness StrategiesGrowth StrategyCompany Overview and Characteristics Financial Report