Konica Minolta 2015 Annual Report Download - page 116
Download and view the complete annual report
Please find page 116 of the 2015 Konica Minolta annual report below. You can navigate through the pages in the report by either clicking on the pages listed below, or by using the keyword search tool below to find specific information within the annual report.-
 1
1 -
2
-
3
-
4
-
5
-
6
-
7
-
8
-
9
-
10
-
11
-
12
-
13
-
14
-
15
-
16
-
17
-
18
-
19
-
20
-
21
-
22
-
23
-
24
-
25
-
26
-
27
-
28
-
29
-
30
-
31
-
32
-
33
-
34
-
35
-
36
-
37
-
38
-
39
-
40
-
41
-
42
-
43
-
44
-
45
-
46
-
47
-
48
-
49
-
50
-
51
-
52
-
53
-
54
-
55
-
56
-
57
-
58
-
59
-
60
-
61
-
62
-
63
-
64
-
65
-
66
-
67
-
68
-
69
-
70
-
71
-
72
-
73
-
74
-
75
-
76
-
77
-
78
-
79
-
80
-
81
-
82
-
83
-
84
-
85
-
86
-
87
-
88
-
89
-
90
-
91
-
92
-
93
-
94
-
95
-
96
-
97
-
98
-
99
-
100
-
101
-
102
-
103
-
104
-
105
-
 106
106 -
 107
107 -
 108
108 -
 109
109 -
 110
110 -
 111
111 -
 112
112 -
 113
113 -
 114
114 -
 115
115 -
 116
116 -
 117
117 -
 118
118 -
 119
119 -
 120
120 -
 121
121 -
 122
122 -
 123
123 -
 124
124 -
 125
125 -
 126
126 -
127
-
128
-
129
-
130
-
131
-
132
-
133
-
134
-
135
-
136
-
137
-
138
-
139
-
140
-
141
-
142
-
143
-
144
 |
 |

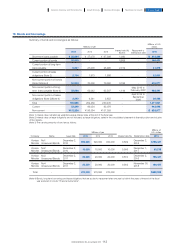
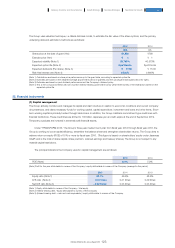
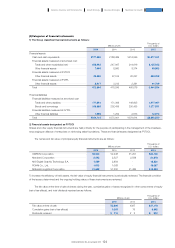
Changes in the fair value of the plan assets are as follows:
Summary of the fair value of the plan assets is as follows:
Millions of yen
Thousands of
U.S. dollars
2015 2014 2015
Balance, beginning of the year ··········································································································································· ¥118,718 ¥109,085 $ 987,917
Interest income ······························································································································································································· 2,407 2,593 20,030
Remeasurement:
Return on plan assets (net) ·············································································································································· 13,109 2,929 109,087
Contributions by the employer ············································································································································ 7,246 7,104 60,298
Benefits paid ······································································································································································································· (7,328) (7,881) (60,980)
Effect of changes in foreign exchange rates and others ························································ 1,496 4,886 12,449
Balance, end of the year ································································································································································ ¥135,649 ¥118,718 $1,128,809
(Note 1) Plan assets are invested in securities, shares and derivatives.
(Note 2) I n accordance with the requirements of defined-benefit pension plans, a regular contribution must be made at least annually. To ensure a
financial balance between forecasted benefit requirement and expected investment income, this amount is calculated based on the
assumptions of interest rates, rates of mortality, withdrawal rates and forecast amounts for other required benefit expenses. Furthermore, this
contribution amount is subject to actuarial review every five years. If the reserve amount is below that provided by minimum funding
standards, a fixed amount must be contributed. The calculation method used for the Company’s defined benefit plans takes into
consideration deductible amounts under tax law, the status of plan assets reserves and various actuarial calculations.
(Note 3) Expected contributions to plan assets in the next fiscal year are ¥7,211 million.
Millions of yen
2015 2014 2013
Quoted market price in an active market Quoted market price in an active market Quoted market price in an active market
Yes No Total Yes No Total Yes No Total
Debt securities (Foreign) ¥27,010 ¥ - ¥ 27,010 23,208 ¥ - ¥ 23,208 22,038 ¥ - ¥ 22,038
Debt securities (Domestic) 3,870 - 3,870 11,030 - 11,030 15,968 - 15,968
Equity securities (Foreign) 7,151 - 7,151 10,417 - 10,417 8,294 - 8,294
Equity securities
(Domestic) 19,552 - 19,552 17,994 - 17,994 11,063 - 11,063
Employee pension trust
(Foreign equity securities) 18,931 - 18,931 11,773 - 11,773 10,354 - 10,354
Employee pension trust
(Domestic equity securities) 10,801 - 10,801 11,824 - 11,824 9,949 - 9,949
Life insurance company
general accounts - 11,920 11,920 - 11,824 11,824 - 17,544 17,544
Others 28,317 8,091 36,409 18,624 2,021 20,645 12,277 1,594 13,872
Total ¥135,649 ¥118,718 ¥109,085
Thousands of U.S. dollars
2015
Quoted market price in an active market
Yes No Total
Debt securities (Foreign) $224,765 $ - $ 224,765
Debt securities (Domestic) 32,204 - 32,204
Equity securities (Foreign) 59,507 - 59,507
Equity securities (Domestic) 162,703 - 162,703
Employee pension trust (Foreign equity securities) 157,535 - 157,535
Employee pension trust (Domestic equity securities) 89,881 - 89,881
Life insurance company general accounts - 99,193 99,193
Others 235,641 67,330 302,979
Total $1,128,809
115
KONICA MINOLTA, INC. Annual Report 2015
Foundation for GrowthBusiness StrategiesGrowth StrategyCompany Overview and Characteristics Financial Report