Kodak 2006 Annual Report Download - page 85
Download and view the complete annual report
Please find page 85 of the 2006 Kodak annual report below. You can navigate through the pages in the report by either clicking on the pages listed below, or by using the keyword search tool below to find specific information within the annual report.-
 1
1 -
2
-
3
-
4
-
5
-
6
-
7
-
8
-
9
-
10
-
11
-
12
-
13
-
14
-
15
-
16
-
17
-
18
-
19
-
20
-
21
-
22
-
23
-
24
-
25
-
26
-
27
-
28
-
29
-
30
-
31
-
32
-
33
-
34
-
35
-
36
-
37
-
38
-
39
-
40
-
41
-
42
-
43
-
44
-
45
-
46
-
47
-
48
-
49
-
50
-
51
-
52
-
53
-
54
-
55
-
56
-
57
-
58
-
59
-
60
-
61
-
62
-
63
-
64
-
65
-
66
-
67
-
68
-
69
-
70
-
71
-
72
-
73
-
74
-
 75
75 -
 76
76 -
 77
77 -
 78
78 -
 79
79 -
 80
80 -
 81
81 -
 82
82 -
 83
83 -
 84
84 -
 85
85 -
 86
86 -
 87
87 -
 88
88 -
 89
89 -
 90
90 -
 91
91 -
 92
92 -
 93
93 -
 94
94 -
 95
95 -
96
-
97
-
98
-
99
-
100
-
101
-
102
-
103
-
104
-
105
-
106
-
107
-
108
-
109
-
110
-
111
-
112
-
113
-
114
-
115
-
116
-
117
-
118
-
119
-
120
-
121
-
122
-
123
-
124
-
125
-
126
-
127
-
128
-
129
-
130
-
131
-
132
-
133
-
134
-
135
-
136
-
137
-
138
-
139
-
140
-
141
-
142
-
143
-
144
-
145
-
146
-
147
-
148
-
149
-
150
-
151
-
152
-
153
-
154
-
155
-
156
-
157
-
158
-
159
-
160
-
161
-
162
-
163
-
164
-
165
-
166
-
167
-
168
-
169
-
170
-
171
-
172
-
173
-
174
-
175
-
176
-
177
-
178
-
179
-
180
-
181
-
182
-
183
-
184
-
185
-
186
-
187
-
188
-
189
-
190
-
191
-
192
-
193
-
194
-
195
-
196
-
197
-
198
-
199
-
200
-
201
-
202
-
203
-
204
-
205
-
206
-
207
-
208
-
209
-
210
-
211
-
212
-
213
-
214
-
215
-
216
-
217
-
218
-
219
-
220
-
221
-
222
-
223
-
224
-
225
-
226
-
227
-
228
-
229
-
230
-
231
-
232
-
233
-
234
-
235
-
236
 |
 |

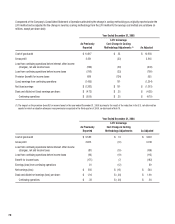
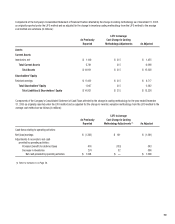
Components of the Company’s Consolidated Statement of Operations affected by the change in costing methodology as originally reported under the
LIFO method and as adjusted for the change in inventory costing methodology from the LIFO method to the average cost method are as follows (in
millions, except per share data):
Year Ended December 31, 2005
LIFO to Average
As Previously Cost Change in Costing
Reported Methodology Adjustments (1) As Adjusted
Cost of goods sold $ 10,617 $ 33 $ 10,650
Gross profit 3,651 (33) 3,618
Loss from continuing operations before interest, other income
(charges), net and income taxes (599) (33) (632)
Loss from continuing operations before income taxes (766) (33) (799)
Provision (benefit) for income taxes 689 (134) 555
(Loss) earnings from continuing operations (1,455) 101 (1,354)
Net (loss) earnings $ (1,362) $ 101 $ (1,261)
Basic and diluted net (loss) earnings per share: $ (4.73) $ .35 $ (4.38)
Continuing operations $ (5.05) $ .35 $ (4.70)
(1) The impact on the provision (benefit) for income taxes for the year ended December 31, 2005 is primarily the result of the reduction in the U.S. net deferred tax
assets for which a valuation allowance was previously recognized in the third quarter of 2005, as disclosed in Note 15.
Year Ended December 31, 2004
LIFO to Average
As Previously Cost Change in Costing
Reported Methodology Adjustments As Adjusted
Cost of goods sold $ 9,582 $ 19 $ 9,601
Gross profit 3,935 (19) 3,916
Loss from continuing operations before interest, other income
(charges), net and income taxes (87) (19) (106)
Loss from continuing operations before income taxes (94) (19) (113)
Benefit for income taxes (175) (7) (182)
Earnings (loss) from continuing operations 81 (12) 69
Net earnings (loss) $ 556 $ (12) $ 544
Basic and diluted net earnings (loss) per share: $ 1.94 $ (.04) $ 1.90
Continuing operations $ .28 $ (.04) $ .24