Kodak 2006 Annual Report Download - page 59
Download and view the complete annual report
Please find page 59 of the 2006 Kodak annual report below. You can navigate through the pages in the report by either clicking on the pages listed below, or by using the keyword search tool below to find specific information within the annual report.-
 1
1 -
2
-
3
-
4
-
5
-
6
-
7
-
8
-
9
-
10
-
11
-
12
-
13
-
14
-
15
-
16
-
17
-
18
-
19
-
20
-
21
-
22
-
23
-
24
-
25
-
26
-
27
-
28
-
29
-
30
-
31
-
32
-
33
-
34
-
35
-
36
-
37
-
38
-
39
-
40
-
41
-
42
-
43
-
44
-
45
-
46
-
47
-
48
-
 49
49 -
 50
50 -
 51
51 -
 52
52 -
 53
53 -
 54
54 -
 55
55 -
 56
56 -
 57
57 -
 58
58 -
 59
59 -
 60
60 -
 61
61 -
 62
62 -
 63
63 -
 64
64 -
 65
65 -
 66
66 -
 67
67 -
 68
68 -
 69
69 -
70
-
71
-
72
-
73
-
74
-
75
-
76
-
77
-
78
-
79
-
80
-
81
-
82
-
83
-
84
-
85
-
86
-
87
-
88
-
89
-
90
-
91
-
92
-
93
-
94
-
95
-
96
-
97
-
98
-
99
-
100
-
101
-
102
-
103
-
104
-
105
-
106
-
107
-
108
-
109
-
110
-
111
-
112
-
113
-
114
-
115
-
116
-
117
-
118
-
119
-
120
-
121
-
122
-
123
-
124
-
125
-
126
-
127
-
128
-
129
-
130
-
131
-
132
-
133
-
134
-
135
-
136
-
137
-
138
-
139
-
140
-
141
-
142
-
143
-
144
-
145
-
146
-
147
-
148
-
149
-
150
-
151
-
152
-
153
-
154
-
155
-
156
-
157
-
158
-
159
-
160
-
161
-
162
-
163
-
164
-
165
-
166
-
167
-
168
-
169
-
170
-
171
-
172
-
173
-
174
-
175
-
176
-
177
-
178
-
179
-
180
-
181
-
182
-
183
-
184
-
185
-
186
-
187
-
188
-
189
-
190
-
191
-
192
-
193
-
194
-
195
-
196
-
197
-
198
-
199
-
200
-
201
-
202
-
203
-
204
-
205
-
206
-
207
-
208
-
209
-
210
-
211
-
212
-
213
-
214
-
215
-
216
-
217
-
218
-
219
-
220
-
221
-
222
-
223
-
224
-
225
-
226
-
227
-
228
-
229
-
230
-
231
-
232
-
233
-
234
-
235
-
236
 |
 |
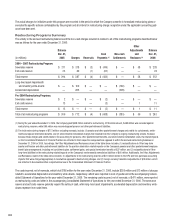
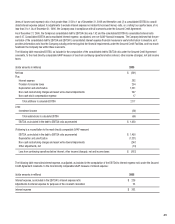
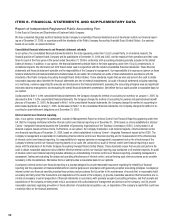
Off-Balance Sheet Arrangements
The Company guarantees debt and other obligations of certain customers. At December 31, 2006, these guarantees totaled a maximum of $150 mil-
lion, with outstanding guaranteed amounts of $131 million. The maximum guarantee amount includes guarantees of up to: $148 million of customer
amounts due to banks and leasing companies in connection with financing of customers’ purchases of product and equipment from the Company
($130 million outstanding), and $2 million to other third parties (less than $1 million outstanding).
The guarantees for the third party debt mature between 2007 and 2011. The customer financing agreements and related guarantees typically have a
term of 90 days for product and short-term equipment financing arrangements, and up to five years for long-term equipment financing arrangements.
These guarantees would require payment from the Company only in the event of default on payment by the respective debtor. In some cases, particu-
larly for guarantees related to equipment financing, the Company has collateral or recourse provisions to recover and sell the equipment to reduce any
losses that might be incurred in connection with the guarantees.
Management believes the likelihood is remote that material payments will be required under any of the guarantees disclosed above. With respect to
the guarantees that the Company issued in the year ended December 31, 2006, the Company assessed the fair value of its obligation to stand ready to
perform under these guarantees by considering the likelihood of occurrence of the specified triggering events or conditions requiring performance as
well as other assumptions and factors.
The Company also guarantees debt owed to banks for some of its consolidated subsidiaries. The maximum amount guaranteed is $799 million,
and the outstanding debt under those guarantees, which is recorded within the short-term borrowings and long-term debt, net of current portion
components in the accompanying Consolidated Statement of Financial Position, is $255 million. These guarantees expire in 2007 through 2025. As of
the closing of the $2.7 billion Secured Credit Facilities on October 18, 2005, a $160 million KPG credit facility was closed. Debt outstanding under the
KPG credit facility of $57 million was repaid and the guarantees of $160 million were terminated. Pursuant to the terms of the Company’s $2.7 billion
Senior Secured Credit Agreement dated October 18, 2005, obligations under the $2.7 billion Secured Credit Facilities and other obligations of the
Company and its subsidiaries to the $2.7 billion Secured Credit Facilities lenders are guaranteed.
The Company issues indemnifications in certain instances when it sells businesses and real estate, and in the ordinary course of business with its
customers, suppliers, service providers and business partners. Further, the Company indemnifies its directors and officers who are, or were, serving
at the Company’s request in such capacities. Historically, costs incurred to settle claims related to these indemnifications have not been material to the
Company’s financial position, results of operations or cash flows. Additionally, the fair value of the indemnifications that the Company issued during
the year ended December 31, 2006 was not material to the Company’s financial position, results of operations or cash flows.
2005
The Company’s cash and cash equivalents increased $410 million, to $1,665 million at December 31, 2005 from $1,255 million at December 31,
2004. The increase resulted primarily from $1,208 million of net cash provided by operating activities and $533 million of net cash provided by financ-
ing activities, offset by $1,304 million of net cash used in investing activities.
The net cash provided by operating activities of $1,208 million was primarily attributable to a decrease in receivables, excluding the impacts of acqui-
sitions, of $228 million, and a decrease in inventories, excluding the impacts of acquisitions, of $274 million. The decrease in receivables, excluding
the impacts of acquisitions, is primarily due to lower customer rebate accruals and lower miscellaneous non-trade receivables, and was also impacted
by the Company’s collection efforts, including customer-sponsored payment programs. The decrease in inventories is primarily due to a combination
of: (1) planned inventory reductions driven by corporate initiatives, (2) an increasingly seasonal demand for digital products in anticipation of the holi-
day season, and (3) a decline in demand for traditional products. In addition, the Company reported a net loss of $1,362 million, which, when adjusted
for the earnings from discontinued operations, cumulative effect of a change in accounting principle, equity in earnings from unconsolidated affiliates,
depreciation and amortization, purchased research and development, the gain on sales of businesses/assets, restructuring costs, asset impairments
and other non-cash charges, and provision for deferred taxes, provided $582 million of operating cash. These sources of cash were further increased
by the favorable impacts of the Company’s continuing progress in the monetization of its intellectual property.
The net cash used in investing activities of $1,304 million was utilized primarily for capital expenditures of $472 million and business acquisitions of
$984 million. These uses of cash were partially offset by $130 million from the sale of assets and investments. The net cash provided by financing
activities of $533 million was primarily the result of a net increase in borrowings of $722 million due to the funding of the acquisition of Creo during
the second quarter of 2005, partially offset by repayments of debt.
Acquisitions were $984 million in 2005, net of cash acquired. Approximately $927 million and $11 million of this amount is related to the acquisitions
of Creo and KPG, respectively. The acquisition of Creo uniquely positions the Company to be the preferred partner for its customers, helping them
improve efficiency, expand their offerings and grow their business. The acquisition of KPG further establishes the Company as a leader in the graphics
communications industry and complements the Company’s existing business in this market. Both Creo and KPG operate within the Graphic Com-
munications Group segment. The remaining amount of $46 million was utilized to complete the acquisition of OREX. The acquisition of OREX adds the
technology of OREX’s small format computed radiography products for use in various health imaging markets.
Capital additions were $472 million in 2005, with the majority of the spending supporting new products, manufacturing productivity and quality
improvements, infrastructure improvements, and ongoing environmental and safety initiatives.