Kodak 2006 Annual Report Download - page 124
Download and view the complete annual report
Please find page 124 of the 2006 Kodak annual report below. You can navigate through the pages in the report by either clicking on the pages listed below, or by using the keyword search tool below to find specific information within the annual report.-
 1
1 -
2
-
3
-
4
-
5
-
6
-
7
-
8
-
9
-
10
-
11
-
12
-
13
-
14
-
15
-
16
-
17
-
18
-
19
-
20
-
21
-
22
-
23
-
24
-
25
-
26
-
27
-
28
-
29
-
30
-
31
-
32
-
33
-
34
-
35
-
36
-
37
-
38
-
39
-
40
-
41
-
42
-
43
-
44
-
45
-
46
-
47
-
48
-
49
-
50
-
51
-
52
-
53
-
54
-
55
-
56
-
57
-
58
-
59
-
60
-
61
-
62
-
63
-
64
-
65
-
66
-
67
-
68
-
69
-
70
-
71
-
72
-
73
-
74
-
75
-
76
-
77
-
78
-
79
-
80
-
81
-
82
-
83
-
84
-
85
-
86
-
87
-
88
-
89
-
90
-
91
-
92
-
93
-
94
-
95
-
96
-
97
-
98
-
99
-
100
-
101
-
102
-
103
-
104
-
105
-
106
-
107
-
108
-
109
-
110
-
111
-
112
-
113
-
 114
114 -
 115
115 -
 116
116 -
 117
117 -
 118
118 -
 119
119 -
 120
120 -
 121
121 -
 122
122 -
 123
123 -
 124
124 -
 125
125 -
 126
126 -
 127
127 -
 128
128 -
 129
129 -
 130
130 -
 131
131 -
 132
132 -
 133
133 -
 134
134 -
135
-
136
-
137
-
138
-
139
-
140
-
141
-
142
-
143
-
144
-
145
-
146
-
147
-
148
-
149
-
150
-
151
-
152
-
153
-
154
-
155
-
156
-
157
-
158
-
159
-
160
-
161
-
162
-
163
-
164
-
165
-
166
-
167
-
168
-
169
-
170
-
171
-
172
-
173
-
174
-
175
-
176
-
177
-
178
-
179
-
180
-
181
-
182
-
183
-
184
-
185
-
186
-
187
-
188
-
189
-
190
-
191
-
192
-
193
-
194
-
195
-
196
-
197
-
198
-
199
-
200
-
201
-
202
-
203
-
204
-
205
-
206
-
207
-
208
-
209
-
210
-
211
-
212
-
213
-
214
-
215
-
216
-
217
-
218
-
219
-
220
-
221
-
222
-
223
-
224
-
225
-
226
-
227
-
228
-
229
-
230
-
231
-
232
-
233
-
234
-
235
-
236
 |
 |

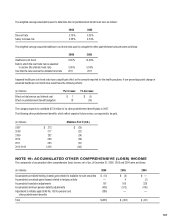
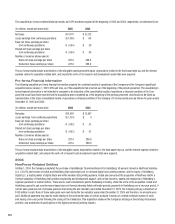
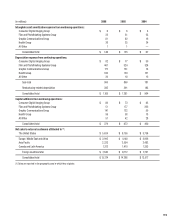
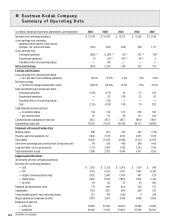
The changes in cost allocation methodologies referred to above increased (decreased) segment earnings (losses) from continuing operations before
interest, other income (charges), net and income taxes for the years ended December 31, 2005 and 2004 as follows:
Year Ended December 31,
(in millions) 2005 2004
Consumer Digital Imaging Group $ (15) $ (133)
Film and Photofinishing Systems Group 93 220
Graphic Communications Group (41) (51)
Health Group 21 34
All Other (58) (70)
Consolidated impact $ — $ —
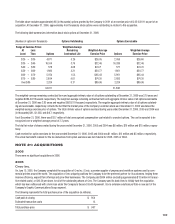
Further, as described in Note 3, “Inventories, Net,” on January 1, 2006, the Company elected to change its method of costing its U.S. inventories from
the LIFO method to the average cost method. This change increased cost of goods sold for the years ended December 31, 2005 and 2004 for each of
the segments as follows:
Year Ended December 31,
(in millions) 2005 2004
Consumer Digital Imaging Group $ 14 $ 3
Film and Photofinishing Systems Group 12 12
Graphic Communications Group 1 1
Health Group 5 2
All Other 1 1
Consolidated impact $ 33 $ 19
Prior period results have been adjusted to reflect the changes in segment reporting structure, the changes in cost allocation methodologies outlined
above, and the change in inventory costing method.