Kodak 2006 Annual Report Download - page 131
Download and view the complete annual report
Please find page 131 of the 2006 Kodak annual report below. You can navigate through the pages in the report by either clicking on the pages listed below, or by using the keyword search tool below to find specific information within the annual report.-
 1
1 -
2
-
3
-
4
-
5
-
6
-
7
-
8
-
9
-
10
-
11
-
12
-
13
-
14
-
15
-
16
-
17
-
18
-
19
-
20
-
21
-
22
-
23
-
24
-
25
-
26
-
27
-
28
-
29
-
30
-
31
-
32
-
33
-
34
-
35
-
36
-
37
-
38
-
39
-
40
-
41
-
42
-
43
-
44
-
45
-
46
-
47
-
48
-
49
-
50
-
51
-
52
-
53
-
54
-
55
-
56
-
57
-
58
-
59
-
60
-
61
-
62
-
63
-
64
-
65
-
66
-
67
-
68
-
69
-
70
-
71
-
72
-
73
-
74
-
75
-
76
-
77
-
78
-
79
-
80
-
81
-
82
-
83
-
84
-
85
-
86
-
87
-
88
-
89
-
90
-
91
-
92
-
93
-
94
-
95
-
96
-
97
-
98
-
99
-
100
-
101
-
102
-
103
-
104
-
105
-
106
-
107
-
108
-
109
-
110
-
111
-
112
-
113
-
114
-
115
-
116
-
117
-
118
-
119
-
120
-
 121
121 -
 122
122 -
 123
123 -
 124
124 -
 125
125 -
 126
126 -
 127
127 -
 128
128 -
 129
129 -
 130
130 -
 131
131 -
 132
132 -
 133
133 -
 134
134 -
 135
135 -
 136
136 -
 137
137 -
 138
138 -
 139
139 -
 140
140 -
 141
141 -
142
-
143
-
144
-
145
-
146
-
147
-
148
-
149
-
150
-
151
-
152
-
153
-
154
-
155
-
156
-
157
-
158
-
159
-
160
-
161
-
162
-
163
-
164
-
165
-
166
-
167
-
168
-
169
-
170
-
171
-
172
-
173
-
174
-
175
-
176
-
177
-
178
-
179
-
180
-
181
-
182
-
183
-
184
-
185
-
186
-
187
-
188
-
189
-
190
-
191
-
192
-
193
-
194
-
195
-
196
-
197
-
198
-
199
-
200
-
201
-
202
-
203
-
204
-
205
-
206
-
207
-
208
-
209
-
210
-
211
-
212
-
213
-
214
-
215
-
216
-
217
-
218
-
219
-
220
-
221
-
222
-
223
-
224
-
225
-
226
-
227
-
228
-
229
-
230
-
231
-
232
-
233
-
234
-
235
-
236
 |
 |

n
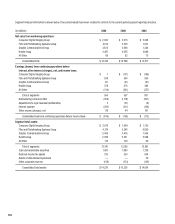
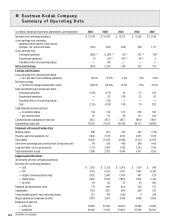
(in millions, except per share data, shareholders, and employees) 2006 2005 2004 2003 2002
Net sales from continuing operations $ 13,274 $ 14,268 $ 13,517 $ 12,909 $ 12,549
(Loss) earnings from continuing
operations before interest, other income
(charges), net, and income taxes (202) (632) (106) 260 1,111
(Loss) earnings from:
Continuing operations (600) (1) (1,354) (2) 69 (3) 163 (4) 726 (5)
Discontinued operations (1) 150 (6) 475 (6) 64 (6) 9
Cumulative effect of accounting change — (57) — — —
Net (Loss) Earnings (601) (1,261) 544 227 735
Earnings and Dividends
(Loss) earnings from continuing operations
— % of net sales from continuing operations (4.5)% (9.5)% 0.5% 1.3% 5.8%
Net (loss) earnings
— % return on average shareholders’ equity (32.8)% (39.9)% 14.5% 7.0% 23.7%
Basic and diluted (loss) earnings per share:
Continuing operations (2.09) (4.70) .24 .57 2.49
Discontinued operations — .52 1.66 .22 .03
Cumulative effect of accounting change — (.20) — — —
Total (2.09) (4.38) 1.90 .79 2.52
Cash dividends declared and paid
— on common shares 144 144 143 330 525
— per common share .50 .50 .50 1.15 1.80
Common shares outstanding at year end 287.3 287.2 286.7 286.6 285.9
Shareholders at year end 63,193 75,619 80,426 85,712 89,988
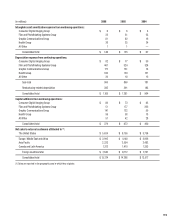
Statement of Financial Position Data
Working capital 586 607 872 423 (716)
Property, plant and equipment, net 2,842 3,778 4,512 5,051 5,378
Total assets 14,320 15,236 15,084 15,213 13,903
Short-term borrowings and current portion of long-term debt 64 819 469 946 1,442
Long-term debt, net of current portion 2,714 2,764 1,852 2,302 1,164
Total shareholders’ equity 1,388 2,282 4,034 3,471 3,029
Supplemental Information
(all amounts are from continuing operations)
Net sales from continuing operations
— CDG $ 2,920 $ 3,215 $ 2,366 $ 1,516 $ 949
— FPG 4,156 5,325 7,051 7,941 8,242
— Graphic Communications Group 3,632 2,990 1,344 967 724
— Health Group 2,497 2,655 2,686 2,431 2,274
— All Other 69 83 70 54 360
Research and development costs 710 892 836 760 757
Depreciation 1,185 1,281 964 839 813
Taxes (excludes payroll, sales and excise taxes) 327 798 (100) 4 268
Wages, salaries and employee benefits 3,097 3,941 4,188 3,960 3,906
Employees at year end
— in the U.S. 20,600 25,500 29,200 33,800 37,900
— worldwide 40,900 51,100 54,800 62,300 68,900
(footnotes on next page)