Kodak 2006 Annual Report Download - page 128
Download and view the complete annual report
Please find page 128 of the 2006 Kodak annual report below. You can navigate through the pages in the report by either clicking on the pages listed below, or by using the keyword search tool below to find specific information within the annual report.-
 1
1 -
2
-
3
-
4
-
5
-
6
-
7
-
8
-
9
-
10
-
11
-
12
-
13
-
14
-
15
-
16
-
17
-
18
-
19
-
20
-
21
-
22
-
23
-
24
-
25
-
26
-
27
-
28
-
29
-
30
-
31
-
32
-
33
-
34
-
35
-
36
-
37
-
38
-
39
-
40
-
41
-
42
-
43
-
44
-
45
-
46
-
47
-
48
-
49
-
50
-
51
-
52
-
53
-
54
-
55
-
56
-
57
-
58
-
59
-
60
-
61
-
62
-
63
-
64
-
65
-
66
-
67
-
68
-
69
-
70
-
71
-
72
-
73
-
74
-
75
-
76
-
77
-
78
-
79
-
80
-
81
-
82
-
83
-
84
-
85
-
86
-
87
-
88
-
89
-
90
-
91
-
92
-
93
-
94
-
95
-
96
-
97
-
98
-
99
-
100
-
101
-
102
-
103
-
104
-
105
-
106
-
107
-
108
-
109
-
110
-
111
-
112
-
113
-
114
-
115
-
116
-
117
-
 118
118 -
 119
119 -
 120
120 -
 121
121 -
 122
122 -
 123
123 -
 124
124 -
 125
125 -
 126
126 -
 127
127 -
 128
128 -
 129
129 -
 130
130 -
 131
131 -
 132
132 -
 133
133 -
 134
134 -
 135
135 -
 136
136 -
 137
137 -
 138
138 -
139
-
140
-
141
-
142
-
143
-
144
-
145
-
146
-
147
-
148
-
149
-
150
-
151
-
152
-
153
-
154
-
155
-
156
-
157
-
158
-
159
-
160
-
161
-
162
-
163
-
164
-
165
-
166
-
167
-
168
-
169
-
170
-
171
-
172
-
173
-
174
-
175
-
176
-
177
-
178
-
179
-
180
-
181
-
182
-
183
-
184
-
185
-
186
-
187
-
188
-
189
-
190
-
191
-
192
-
193
-
194
-
195
-
196
-
197
-
198
-
199
-
200
-
201
-
202
-
203
-
204
-
205
-
206
-
207
-
208
-
209
-
210
-
211
-
212
-
213
-
214
-
215
-
216
-
217
-
218
-
219
-
220
-
221
-
222
-
223
-
224
-
225
-
226
-
227
-
228
-
229
-
230
-
231
-
232
-
233
-
234
-
235
-
236
 |
 |

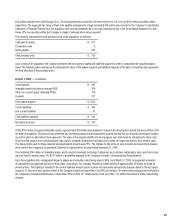
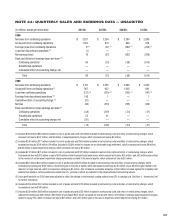
NOTE 24: QUARTERLY SALES AND EARNINGS DATA — UNAUDITED
(in millions, except per share data) 4th Qtr. 3rd Qtr. 2nd Qtr. 1st Qtr.
2006
Net sales from continuing operations $ 3,821 $ 3,204 $ 3,360 $ 2,889
Gross profit from continuing operations 1,007 874 809 678
Earnings (loss) from continuing operations 17 (4) (37) (3) (282) (2) (298) (1)
Loss from discontinued operations (10) (1) — —
Net earnings (loss) 16 (37) (282) (298)
Basic and diluted net earnings (loss) per share (11)
Continuing operations .06 (.13) (.98) (1.04)
Discontinued operations — — — —
Cumulative effect of accounting change, net — — — —
Total .06 (.13) (.98) (1.04)
2005
Net sales from continuing operations $ 4,197 $ 3,553 $ 3,686 $ 2,832
Gross profit from continuing operations (5) 967 922 1,038 691
Loss from continuing operations (137) (9) (915) (8) (155) (7) (147) (6)
Earnings from discontinued operations (10) 148 1 — 1
Cumulative effect of accounting change (12) (57) — — —
Net loss (46) (914) (155) (146)
Basic and diluted net (loss) earnings per share (11)
Continuing operations (.48) (3.19) (.54) (.51)
Discontinued operations .52 .01 — —
Cumulative effect of accounting change, net (.20) — — —
Total (.16) (3.18) (.54) (.51)
(1) Includes $228 million ($83 million included in cost of goods sold and $145 million included in restructuring costs and other) of restructuring charges, which
increased net loss by $197 million; and $4 million of asset impairment charges, which increased net loss by $3 million.
(2) Includes $246 million ($77 million included in cost of goods sold and $169 million included in restructuring costs and other) of restructuring charges, which
increased net loss by $214 million; $4 million (included in SG&A) related to charges for an unfavorable legal settlement, which increased net loss by $4 million;
and $9 million of asset impairment charges, which increased net loss by $9 million.
(3) Includes $212 million ($75 million included in cost of goods sold and $137 million included in restructuring costs and other) of restructuring charges, which
increased net loss by $202 million; a gain of $43 million related to property and asset sales, which reduced net loss by $33 million; and a $2 million gain related
to the reversal of certain asset impairment charges previously recorded in the second quarter, which reduced net loss by $2 million.
(4) Includes $82 million ($62 million included in cost of goods sold and $20 million included in restructuring costs and other) of restructuring charges, which
decreased net earnings by $105 million; a $3 million gain on the sale of assets, which decreased net earnings by $1 million; and a $6 million gain related to the
reduction of legal reserves, which increased net earnings by $6 million. Also included is a valuation allowance of $90 million recorded against the Company’s net
deferred tax assets in certain jurisdictions outside the U.S., portions of which are reflected in the aforementioned restructuring amount.
(5) Gross profit amounts for 2005 have been adjusted to reflect the change in the inventory costing method from LIFO to average cost. See Note 3, “Inventories, Net”
for further information.
(6) Includes $206 million ($91 million included in cost of goods sold and $115 million included in restructuring costs and other) of restructuring charges, which
increased net loss by $149 million.
(7) Includes $339 million ($86 million included in cost of goods sold and $253 million included in restructuring costs and other) of restructuring charges, which
reduced net earnings by $240 million; $64 million of purchased R&D, which increased net loss by $39 million; $19 million of strategic asset impairment charges
related to Lucky Film, which increased net loss by $19 million; and a $13 million gain on the sale of properties, which reduced net loss by $11 million.