Kodak 2006 Annual Report Download - page 80
Download and view the complete annual report
Please find page 80 of the 2006 Kodak annual report below. You can navigate through the pages in the report by either clicking on the pages listed below, or by using the keyword search tool below to find specific information within the annual report.-
 1
1 -
2
-
3
-
4
-
5
-
6
-
7
-
8
-
9
-
10
-
11
-
12
-
13
-
14
-
15
-
16
-
17
-
18
-
19
-
20
-
21
-
22
-
23
-
24
-
25
-
26
-
27
-
28
-
29
-
30
-
31
-
32
-
33
-
34
-
35
-
36
-
37
-
38
-
39
-
40
-
41
-
42
-
43
-
44
-
45
-
46
-
47
-
48
-
49
-
50
-
51
-
52
-
53
-
54
-
55
-
56
-
57
-
58
-
59
-
60
-
61
-
62
-
63
-
64
-
65
-
66
-
67
-
68
-
69
-
 70
70 -
 71
71 -
 72
72 -
 73
73 -
 74
74 -
 75
75 -
 76
76 -
 77
77 -
 78
78 -
 79
79 -
 80
80 -
 81
81 -
 82
82 -
 83
83 -
 84
84 -
 85
85 -
 86
86 -
 87
87 -
 88
88 -
 89
89 -
 90
90 -
91
-
92
-
93
-
94
-
95
-
96
-
97
-
98
-
99
-
100
-
101
-
102
-
103
-
104
-
105
-
106
-
107
-
108
-
109
-
110
-
111
-
112
-
113
-
114
-
115
-
116
-
117
-
118
-
119
-
120
-
121
-
122
-
123
-
124
-
125
-
126
-
127
-
128
-
129
-
130
-
131
-
132
-
133
-
134
-
135
-
136
-
137
-
138
-
139
-
140
-
141
-
142
-
143
-
144
-
145
-
146
-
147
-
148
-
149
-
150
-
151
-
152
-
153
-
154
-
155
-
156
-
157
-
158
-
159
-
160
-
161
-
162
-
163
-
164
-
165
-
166
-
167
-
168
-
169
-
170
-
171
-
172
-
173
-
174
-
175
-
176
-
177
-
178
-
179
-
180
-
181
-
182
-
183
-
184
-
185
-
186
-
187
-
188
-
189
-
190
-
191
-
192
-
193
-
194
-
195
-
196
-
197
-
198
-
199
-
200
-
201
-
202
-
203
-
204
-
205
-
206
-
207
-
208
-
209
-
210
-
211
-
212
-
213
-
214
-
215
-
216
-
217
-
218
-
219
-
220
-
221
-
222
-
223
-
224
-
225
-
226
-
227
-
228
-
229
-
230
-
231
-
232
-
233
-
234
-
235
-
236
 |
 |

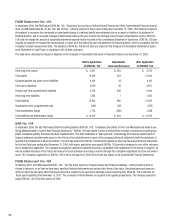
The Company has determined the pro forma net earnings and net earnings per share information as if the fair value method of SFAS No. 123, “Ac-
counting for Stock-Based Compensation,” had been applied to its stock-based employee compensation in 2004. The pro forma information is as
follows:
Year Ended
(in millions, except per share data) December 31, 2004
Net earnings, as reported $ 544
Deduct: Total stock-based employee compensation expense determined under
fair value method for all awards, net of related tax effects (12)
Pro forma net earnings $ 532
Earnings per share:
Basic — as reported $ 1.90
Basic — pro forma $ 1.86
Diluted — as reported $ 1.90
Diluted — pro forma $ 1.85
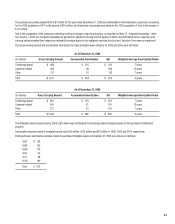
The fair value of each option award is estimated on the date of grant using the Black-Scholes option valuation model that uses the assumptions noted
in the following table. Expected volatilities are based on historical volatility of the Company’s stock, management’s estimate of implied volatility of
the Company’s stock, and other factors. The expected term of options granted is derived from the vesting period of the award, as well as historical
exercise behavior, and represents the period of time that options granted are expected to be outstanding. The risk-free rate is calculated using the U.S.
Treasury yield curve, and is based on the expected term of the option. The Company uses historical data to estimate forfeitures.
The Black-Scholes option pricing model was used with the following weighted-average assumptions for options issued in each year:
2006 2005 2004
Weighted-average risk-free interest rate 4.6% 3.9% 3.1%
Risk-free interest rates 4.5% – 5.1% 3.6% – 4.5% 2.5% – 3.8%
Weighted-average expected option lives 6 years 5 years 4 years
Expected option lives 3 - 7 years 3 - 7 years 4 years
Weighted-average volatility 34% 35% 37%
Expected volatilities 29% – 36% 31% – 36% 36% – 40%
Weighted-average expected dividend yield 1.9% 1.8% 1.6%
Expected dividend yields 1.8% – 2.3% 1.5% - 1.9% 1.6% – 1.8%
The weighted-average fair value per option granted in 2006, 2005 and 2004 was $8.18, $7.70 and $8.77, respectively.
For purposes of pro forma disclosures, the estimated fair value of the options is amortized to compensation expense over the options’ vesting period
(1-3 years).
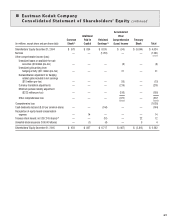
Comprehensive Income
Comprehensive income consists of net (loss) earnings, the net unrealized gains or losses on available-for-sale marketable securities, foreign currency
translation adjustments, minimum pension liability adjustments, and unrealized gains and losses on financial instruments qualifying for cash flow
hedge accounting, and is presented in the accompanying Consolidated Statement of Shareholders’ Equity.
Segment Reporting
The Company reports net sales from continuing operations, earnings (losses) from continuing operations before interest, other income (charges), net
and income taxes, and certain expense, asset and geographical information about its reportable segments. Reportable segments are components of
the Company for which separate financial information is available that is evaluated regularly by the chief operating decision maker in deciding how
to allocate resources and in assessing performance. In December 2006, the Company announced an organizational realignment that will change the
current reportable segment structure effective January 1, 2007. See Note 23, “Segment Information,” for a discussion of this change.