Kodak 2006 Annual Report Download - page 35
Download and view the complete annual report
Please find page 35 of the 2006 Kodak annual report below. You can navigate through the pages in the report by either clicking on the pages listed below, or by using the keyword search tool below to find specific information within the annual report.-
 1
1 -
2
-
3
-
4
-
5
-
6
-
7
-
8
-
9
-
10
-
11
-
12
-
13
-
14
-
15
-
16
-
17
-
18
-
19
-
20
-
21
-
22
-
23
-
24
-
 25
25 -
 26
26 -
 27
27 -
 28
28 -
 29
29 -
 30
30 -
 31
31 -
 32
32 -
 33
33 -
 34
34 -
 35
35 -
 36
36 -
 37
37 -
 38
38 -
 39
39 -
 40
40 -
 41
41 -
 42
42 -
 43
43 -
 44
44 -
 45
45 -
46
-
47
-
48
-
49
-
50
-
51
-
52
-
53
-
54
-
55
-
56
-
57
-
58
-
59
-
60
-
61
-
62
-
63
-
64
-
65
-
66
-
67
-
68
-
69
-
70
-
71
-
72
-
73
-
74
-
75
-
76
-
77
-
78
-
79
-
80
-
81
-
82
-
83
-
84
-
85
-
86
-
87
-
88
-
89
-
90
-
91
-
92
-
93
-
94
-
95
-
96
-
97
-
98
-
99
-
100
-
101
-
102
-
103
-
104
-
105
-
106
-
107
-
108
-
109
-
110
-
111
-
112
-
113
-
114
-
115
-
116
-
117
-
118
-
119
-
120
-
121
-
122
-
123
-
124
-
125
-
126
-
127
-
128
-
129
-
130
-
131
-
132
-
133
-
134
-
135
-
136
-
137
-
138
-
139
-
140
-
141
-
142
-
143
-
144
-
145
-
146
-
147
-
148
-
149
-
150
-
151
-
152
-
153
-
154
-
155
-
156
-
157
-
158
-
159
-
160
-
161
-
162
-
163
-
164
-
165
-
166
-
167
-
168
-
169
-
170
-
171
-
172
-
173
-
174
-
175
-
176
-
177
-
178
-
179
-
180
-
181
-
182
-
183
-
184
-
185
-
186
-
187
-
188
-
189
-
190
-
191
-
192
-
193
-
194
-
195
-
196
-
197
-
198
-
199
-
200
-
201
-
202
-
203
-
204
-
205
-
206
-
207
-
208
-
209
-
210
-
211
-
212
-
213
-
214
-
215
-
216
-
217
-
218
-
219
-
220
-
221
-
222
-
223
-
224
-
225
-
226
-
227
-
228
-
229
-
230
-
231
-
232
-
233
-
234
-
235
-
236
 |
 |
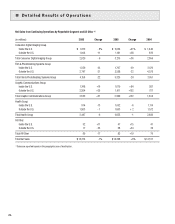
2006 COMPARED WITH 2005
Results of Operations — Continuing Operations
Consolidated
Worldwide Revenues
Net worldwide sales were $13,274 million for 2006 as compared with $14,268 million for 2005, representing a decrease of $994 million or 7%. The
decrease in net sales was primarily due to declines in volumes and unfavorable price/mix, which decreased sales by approximately 9.1 and 2.8 per-
centage points, respectively. The decrease in volumes was primarily driven by declines in the consumer film capture SPG, photofinishing services SPG,
and consumer output SPG within the FPG segment; the consumer digital capture SPG within the CDG segment; the digital output SPG and radiology
film SPG within the KHG segment; and the traditional prepress consumables SPG within the GCG segment. Unfavorable price/mix was primarily driven
by the consumer film capture SPG and consumer output SPG within the FPG segment; the kiosk SPG and consumer digital capture SPG within the
CDG segment; and the traditional prepress consumables SPG and digital prepress consumables SPG within the GCG segment. These decreases were
partially offset by the acquisitions of Kodak Polychrome Graphics (KPG) and Creo in the prior year, which together contributed $639 million or approxi-
mately 4.4 percentage points of an increase to the current year. Sales were also positively impacted by favorable foreign exchange, which increased
net sales by $68 million or approximately 0.5 percentage points.
Net sales in the U.S. were $5,445 million for 2006 as compared with $5,979 million for the prior year, representing a decrease of $534 million, or
9%. Net sales outside the U.S. were $7,829 million for the current year as compared with $8,289 million for the prior year, representing a decrease of
$460 million, or 6%, which includes the positive impact of foreign currency fluctuations of $68 million, or approximately 1%.
Digital Strategic Product Groups’ Revenues
The Company’s digital product sales, including new technologies product sales, were $7,736 million for 2006 as compared with $7,428 million for the
prior year, representing an increase of $308 million, or 4%, primarily driven by the Creo and KPG acquisitions, partially offset by the decline in digital
cameras within the consumer digital capture SPG of the CDG segment. Product sales from new technologies, which are included in digital product
sales, were $49 million in the current year and $57 million in the prior year.
Traditional Strategic Product Groups’ Revenues
Net sales of the Company’s traditional products were $5,538 million for 2006 as compared with $6,840 million for the prior year, representing a
decrease of $1,302 million, or 19%, primarily driven by declines in the consumer film capture SPG, the photofinishing services SPG and the consumer
output SPG.
Foreign Revenues
The Company’s operations outside the U.S. are reported in three regions: (1) the Europe, Africa and Middle East region (EAMER), (2) the Asia Pacific
region and (3) the Canada and Latin America region. Net sales in EAMER were $4,065 million for 2006 as compared with $4,223 million for 2005,
representing a decrease of $158 million, or 4%. The decrease in net sales for the year included the favorable impact of foreign currency fluctuations
of 1%. Net sales in the Asia Pacific region were $2,396 million for 2006 as compared with $2,652 million for 2005, representing a decrease of $256
million, or 10%. The impact of foreign exchange on net sales for the period was immaterial. Net sales in the Canada and Latin America region were
$1,368 million for 2006 as compared with $1,414 million for 2005, representing a decrease of $46 million, or 3%. The decrease in net sales for the
year included the favorable impact of foreign currency fluctuations of 2%.
Gross Profit
Gross profit was $3,368 million for 2006 as compared with $3,618 million for 2005, representing a decrease of $250 million, or 7%. The gross profit
margin was 25.4% in the current year as compared with 25.4% in the prior year. Favorable price/mix and foreign exchange positively impacted gross
profit margins by approximately 0.7 percentage points and 0.1 percentage points, respectively. Additionally, the prior year acquisitions of KPG and Creo
favorably impacted gross profit margins by approximately 0.3 percentage points.
These increases were offset by declines in volume, which reduced gross profit margins by approximately 0.6 percentage points, and increased manu-
facturing and other costs, which reduced gross profit margins by approximately 0.5 percentage points and were largely driven by increased silver and
aluminum commodity costs.
The positive price/mix impact referred to above was primarily driven by extensions and amendments of existing license arrangements and a new
licensing arrangement within the consumer digital capture SPG. The non-recurring portions of these licensing arrangements contributed approximately
1.4% of revenue to consolidated gross profit dollars in the current year, as compared with 0.4% of revenue to consolidated gross profit dollars for
similar arrangements in the prior year. The positive impact of these arrangements was partially offset by negative price/mix within the consumer film
capture SPG and consumer output SPG within the FPG segment; the digital capture solutions SPG within the KHG segment; and the kiosk SPG and
consumer digital capture SPG within the CDG segment. The volume declines were primarily driven by the consumer film capture SPG and consumer
output SPG within the FPG segment; and the consumer digital capture SPG within the CDG segment.