Kodak 2006 Annual Report Download - page 113
Download and view the complete annual report
Please find page 113 of the 2006 Kodak annual report below. You can navigate through the pages in the report by either clicking on the pages listed below, or by using the keyword search tool below to find specific information within the annual report.-
 1
1 -
2
-
3
-
4
-
5
-
6
-
7
-
8
-
9
-
10
-
11
-
12
-
13
-
14
-
15
-
16
-
17
-
18
-
19
-
20
-
21
-
22
-
23
-
24
-
25
-
26
-
27
-
28
-
29
-
30
-
31
-
32
-
33
-
34
-
35
-
36
-
37
-
38
-
39
-
40
-
41
-
42
-
43
-
44
-
45
-
46
-
47
-
48
-
49
-
50
-
51
-
52
-
53
-
54
-
55
-
56
-
57
-
58
-
59
-
60
-
61
-
62
-
63
-
64
-
65
-
66
-
67
-
68
-
69
-
70
-
71
-
72
-
73
-
74
-
75
-
76
-
77
-
78
-
79
-
80
-
81
-
82
-
83
-
84
-
85
-
86
-
87
-
88
-
89
-
90
-
91
-
92
-
93
-
94
-
95
-
96
-
97
-
98
-
99
-
100
-
101
-
102
-
 103
103 -
 104
104 -
 105
105 -
 106
106 -
 107
107 -
 108
108 -
 109
109 -
 110
110 -
 111
111 -
 112
112 -
 113
113 -
 114
114 -
 115
115 -
 116
116 -
 117
117 -
 118
118 -
 119
119 -
 120
120 -
 121
121 -
 122
122 -
 123
123 -
124
-
125
-
126
-
127
-
128
-
129
-
130
-
131
-
132
-
133
-
134
-
135
-
136
-
137
-
138
-
139
-
140
-
141
-
142
-
143
-
144
-
145
-
146
-
147
-
148
-
149
-
150
-
151
-
152
-
153
-
154
-
155
-
156
-
157
-
158
-
159
-
160
-
161
-
162
-
163
-
164
-
165
-
166
-
167
-
168
-
169
-
170
-
171
-
172
-
173
-
174
-
175
-
176
-
177
-
178
-
179
-
180
-
181
-
182
-
183
-
184
-
185
-
186
-
187
-
188
-
189
-
190
-
191
-
192
-
193
-
194
-
195
-
196
-
197
-
198
-
199
-
200
-
201
-
202
-
203
-
204
-
205
-
206
-
207
-
208
-
209
-
210
-
211
-
212
-
213
-
214
-
215
-
216
-
217
-
218
-
219
-
220
-
221
-
222
-
223
-
224
-
225
-
226
-
227
-
228
-
229
-
230
-
231
-
232
-
233
-
234
-
235
-
236
 |
 |

0
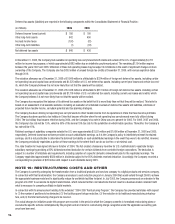
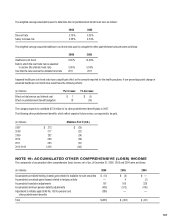
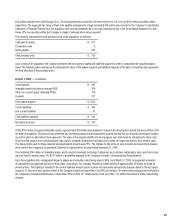
Other postretirement benefit cost for the Company’s U.S., United Kingdom, and Canada plans included:
(in millions) 2006 2005 2004
Components of net postretirement benefit cost
Service cost $ 11 $ 14 $ 15
Interest cost 166 170 189
Amortization of:
Prior service cost (46) (52) (59)
Actuarial loss 50 68 85
Other postretirement benefit cost before curtailment and
settlement gains 181 200 230
Curtailment gains (17) (28) (63)
Settlement gains — — (64)
Net other postretirement benefit cost from continuing operations $ 164 $ 172 $ 103
The estimated prior service credit and net actuarial loss that will be amortized from accumulated other comprehensive loss into net periodic benefit
cost over the next fiscal year is $44 million and $59 million, respectively.
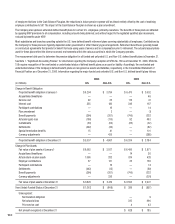
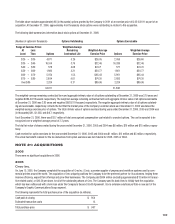
During the quarter ended June 30, 2004, the Company adopted the provisions of FSP 106-2 with respect to its U.S. Other Postretirement Plan, which
resulted in a remeasurement of the Plan’s accumulated projected benefit obligation (APBO) as of April 1, 2004. This remeasurement takes into ac-
count the impact of the subsidy the Company will receive under the Medicare Prescription Drug, Improvement and Modernization Act of 2003 (the
Act) and certain actuarial assumption changes including: (1) changes in participation rates, (2) a decrease in the Company’s Medicare plan premiums,
and (3) a decrease in the discount rate from 6.00% to 5.75%. The actuarially determined impact of the subsidy reduced the APBO by approximately
$228 million. The effect of the subsidy on the measurement of the net periodic other postretirement benefit cost in 2004 was to reduce the cost by
approximately $52 million as follows:
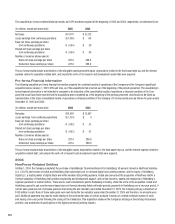
12 months ended December 31, 2004
(in millions) Effect of Subsidy Effect of Assumption Changes Total
Service cost $ — $ 1 $ 1
Interest cost 13 13 26
Amortization of actuarial gain 17 8 25
$ 30 $ 22 $ 52
The effect of the subsidy has been included in the measurement of the net periodic other postretirement cost subsequent to 2004.
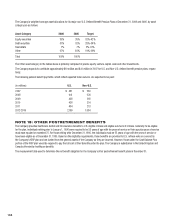
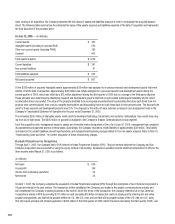
The U.S. plan represents approximately 97% of the total other postretirement net benefit obligation as of both December 31, 2006 and 2005 and,
therefore, the weighted-average assumptions used to compute the other postretirement benefit amounts approximate the U.S. assumptions.
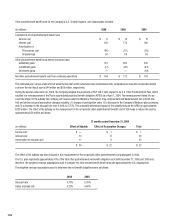
The weighted-average assumptions used to determine the net benefit obligations were as follows:
2006 2005
Discount rate 5.73% 5.50%
Salary increase rate 4.22% 4.60%