Kodak 2006 Annual Report Download - page 42
Download and view the complete annual report
Please find page 42 of the 2006 Kodak annual report below. You can navigate through the pages in the report by either clicking on the pages listed below, or by using the keyword search tool below to find specific information within the annual report.-
 1
1 -
2
-
3
-
4
-
5
-
6
-
7
-
8
-
9
-
10
-
11
-
12
-
13
-
14
-
15
-
16
-
17
-
18
-
19
-
20
-
21
-
22
-
23
-
24
-
25
-
26
-
27
-
28
-
29
-
30
-
31
-
 32
32 -
 33
33 -
 34
34 -
 35
35 -
 36
36 -
 37
37 -
 38
38 -
 39
39 -
 40
40 -
 41
41 -
 42
42 -
 43
43 -
 44
44 -
 45
45 -
 46
46 -
 47
47 -
 48
48 -
 49
49 -
 50
50 -
 51
51 -
 52
52 -
53
-
54
-
55
-
56
-
57
-
58
-
59
-
60
-
61
-
62
-
63
-
64
-
65
-
66
-
67
-
68
-
69
-
70
-
71
-
72
-
73
-
74
-
75
-
76
-
77
-
78
-
79
-
80
-
81
-
82
-
83
-
84
-
85
-
86
-
87
-
88
-
89
-
90
-
91
-
92
-
93
-
94
-
95
-
96
-
97
-
98
-
99
-
100
-
101
-
102
-
103
-
104
-
105
-
106
-
107
-
108
-
109
-
110
-
111
-
112
-
113
-
114
-
115
-
116
-
117
-
118
-
119
-
120
-
121
-
122
-
123
-
124
-
125
-
126
-
127
-
128
-
129
-
130
-
131
-
132
-
133
-
134
-
135
-
136
-
137
-
138
-
139
-
140
-
141
-
142
-
143
-
144
-
145
-
146
-
147
-
148
-
149
-
150
-
151
-
152
-
153
-
154
-
155
-
156
-
157
-
158
-
159
-
160
-
161
-
162
-
163
-
164
-
165
-
166
-
167
-
168
-
169
-
170
-
171
-
172
-
173
-
174
-
175
-
176
-
177
-
178
-
179
-
180
-
181
-
182
-
183
-
184
-
185
-
186
-
187
-
188
-
189
-
190
-
191
-
192
-
193
-
194
-
195
-
196
-
197
-
198
-
199
-
200
-
201
-
202
-
203
-
204
-
205
-
206
-
207
-
208
-
209
-
210
-
211
-
212
-
213
-
214
-
215
-
216
-
217
-
218
-
219
-
220
-
221
-
222
-
223
-
224
-
225
-
226
-
227
-
228
-
229
-
230
-
231
-
232
-
233
-
234
-
235
-
236
 |
 |
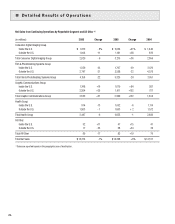
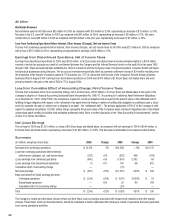
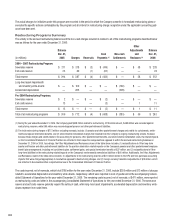
Loss From Continuing Operations Before Interest, Other Income (Charges), Net and Income Taxes
The loss from continuing operations before interest, other income (charges), net and income taxes for All Other was $214 million in 2006 as compared
with a loss of $231 million in 2005. This improvement in earnings was primarily driven by overall SG&A cost reductions of $18 million, and reductions
in R&D spending for the display business of $26 million, partially offset by costs associated with the Company’s new consumer inkjet printers, which
were announced in February 2007.
(Loss) Earnings from Discontinued Operations, Net of Income Taxes
The loss from discontinued operations for 2006 was $1 million, or $.00 per basic and diluted share, as compared with earnings from discontinued
operations for 2005 of $150 million, or $.52 per basic and diluted share. The 2005 earnings from discontinued operations were primarily related to a
$203 million reversal of certain tax accruals as a result of a settlement between the Company and the Internal Revenue Service on the audit of the tax
years 1993 through 1998. These accruals had been established in 1994 in connection with the Company’s sale of its pharmaceutical, consumer health
and household products businesses during that year. The tax accrual reversals were partially offset by a pension settlement charge of $54 million
resulting from the finalization of the transfer of pension assets to ITT Industries, Inc. (ITT) in connection with the sale of the Company’s Remote Sens-
ing Systems business (RSS) in August 2004.
Loss from Cumulative Effect of Accounting Change, Net of Income Taxes
There was no loss from cumulative effect of accounting change, net of income taxes for 2006. The loss from cumulative effect of an account-
ing change, net of income taxes, of $57 million or $.20 per basic and diluted share for 2005 was the result of the Company’s adoption of Financial
Accounting Standards Board Interpretation No. (FIN) 47, “Accounting for Conditional Asset Retirement Obligations,” as of December 31, 2005. Under
FIN 47, the Company is required to record an obligation and an asset for the present value of the estimated cost of fulfilling its legal obligation with
respect to the retirement of an asset when the timing or method of settling that obligation is conditional upon a future event (for example, the sale of,
exiting from or disposal of an asset - the “settlement date”). The primary application of FIN 47 to the Company is with respect to asbestos remedia-
tion. The $57 million charge represents the present value of the Company’s asset retirement obligations (net of the related unamortized asset) relating
to facilities with estimated settlement dates. Refer to further discussion in the “New Accounting Pronouncements” section of Item 7 for further
information.
Net Loss
The consolidated net loss for 2006 was $601 million, or a loss of $2.09 per basic and diluted share, as compared with a net loss for 2005 of $1,261
million, or a loss of $4.38 per basic and diluted share, representing an increase in earnings of $660 million or 52%. This improvement is attributable
to the reasons outlined above.
2005 COMPARED WITH 2004
Results of Operations — Continuing Operations
Consolidated
Worldwide Revenues
Net worldwide sales were $14,268 million for 2005 as compared with $13,517 million for 2004, representing an increase of $751 million or 6%. This
increase in net sales was primarily attributable to the acquisitions of KPG, Creo and NexPress, which contributed $1,562 million or approximately 11.6
percentage points to sales, and favorable exchange, which increased sales by approximately 0.5 percentage points. These increases were partially
offset by declines in volumes and declines in price/mix, which decreased 2005 sales by approximately 1.9 and 4.6 percentage points, respectively.
The decrease in volumes was primarily driven by declines in the consumer film capture SPG, the photofinishing services SPG, and the consumer
output SPG within the FPG segment, and the digital output, film capture, and output SPGs within the Health Group segment. The decrease in price/mix
was primarily driven by the film capture SPG within the FPG segment; the consumer digital capture SPG within the CDG segment; and the digital
capture SPG within the Health Group segment.
Net sales in the U.S. were $5,979 million for 2005 as compared with $5,658 million for the prior year, representing an increase of $321 million, or
6%. Net sales outside the U.S. were $8,289 million for 2005 as compared with $7,859 million for 2004, representing an increase of $430 million, or
5%, which includes a favorable impact from exchange of 1%.
Digital Strategic Product Groups’ Revenues
The Company’s digital product sales, including new technologies product sales of $57 million, were $7,428 million for 2005 as compared with $5,153
million, including new technologies of $46 million, for the prior year, representing an increase of $2,275 million, or 44%, primarily driven by the digital
portion of KPG and Creo, the consumer digital capture SPG, the kiosk SPG, and the home printing solutions SPG.