Kodak 2006 Annual Report Download - page 84
Download and view the complete annual report
Please find page 84 of the 2006 Kodak annual report below. You can navigate through the pages in the report by either clicking on the pages listed below, or by using the keyword search tool below to find specific information within the annual report.-
 1
1 -
2
-
3
-
4
-
5
-
6
-
7
-
8
-
9
-
10
-
11
-
12
-
13
-
14
-
15
-
16
-
17
-
18
-
19
-
20
-
21
-
22
-
23
-
24
-
25
-
26
-
27
-
28
-
29
-
30
-
31
-
32
-
33
-
34
-
35
-
36
-
37
-
38
-
39
-
40
-
41
-
42
-
43
-
44
-
45
-
46
-
47
-
48
-
49
-
50
-
51
-
52
-
53
-
54
-
55
-
56
-
57
-
58
-
59
-
60
-
61
-
62
-
63
-
64
-
65
-
66
-
67
-
68
-
69
-
70
-
71
-
72
-
73
-
 74
74 -
 75
75 -
 76
76 -
 77
77 -
 78
78 -
 79
79 -
 80
80 -
 81
81 -
 82
82 -
 83
83 -
 84
84 -
 85
85 -
 86
86 -
 87
87 -
 88
88 -
 89
89 -
 90
90 -
 91
91 -
 92
92 -
 93
93 -
 94
94 -
95
-
96
-
97
-
98
-
99
-
100
-
101
-
102
-
103
-
104
-
105
-
106
-
107
-
108
-
109
-
110
-
111
-
112
-
113
-
114
-
115
-
116
-
117
-
118
-
119
-
120
-
121
-
122
-
123
-
124
-
125
-
126
-
127
-
128
-
129
-
130
-
131
-
132
-
133
-
134
-
135
-
136
-
137
-
138
-
139
-
140
-
141
-
142
-
143
-
144
-
145
-
146
-
147
-
148
-
149
-
150
-
151
-
152
-
153
-
154
-
155
-
156
-
157
-
158
-
159
-
160
-
161
-
162
-
163
-
164
-
165
-
166
-
167
-
168
-
169
-
170
-
171
-
172
-
173
-
174
-
175
-
176
-
177
-
178
-
179
-
180
-
181
-
182
-
183
-
184
-
185
-
186
-
187
-
188
-
189
-
190
-
191
-
192
-
193
-
194
-
195
-
196
-
197
-
198
-
199
-
200
-
201
-
202
-
203
-
204
-
205
-
206
-
207
-
208
-
209
-
210
-
211
-
212
-
213
-
214
-
215
-
216
-
217
-
218
-
219
-
220
-
221
-
222
-
223
-
224
-
225
-
226
-
227
-
228
-
229
-
230
-
231
-
232
-
233
-
234
-
235
-
236
 |
 |

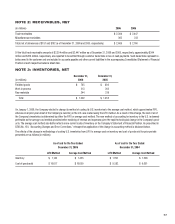
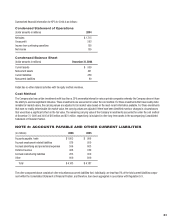
NOTE 2: RECEIVABLES, NET
(in millions) 2006 2005
Trade receivables $ 2,304 $ 2,447
Miscellaneous receivables 365 313
Total (net of allowances of $157 and $162 as of December 31, 2006 and 2005, respectively) $ 2,669 $ 2,760
Of the total trade receivable amounts of $2,304 million and $2,447 million as of December 31, 2006 and 2005, respectively, approximately $344
million and $374 million, respectively, are expected to be settled through customer deductions in lieu of cash payments. Such deductions represent re-
bates owed to the customer and are included in accounts payable and other current liabilities in the accompanying Consolidated Statement of Financial
Position at each respective balance sheet date.
NOTE 3: INVENTORIES, NET
December 31, December 31,
(in millions) 2006 2005
Finished goods $ 745 $ 893
Work in process 213 243
Raw materials 244 319
Total $ 1,202 $ 1,455
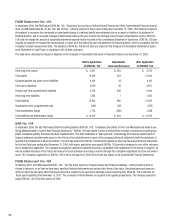
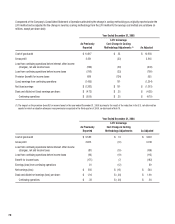
On January 1, 2006, the Company elected to change its method of costing its U.S. inventories to the average cost method, which approximates FIFO,
whereas in all prior years most of the Company’s inventory in the U.S. was costed using the LIFO method. As a result of this change, the cost of all of
the Company’s inventories is determined by either the FIFO or average cost method. The new method of accounting for inventory in the U.S. is deemed
preferable as the average cost method provides better matching of revenue and expenses given the rapid technological change in the Company’s prod-
ucts. The average cost method also better reflects more current costs of inventory on the Company’s Statement of Financial Position. As prescribed in
SFAS No. 154, “Accounting Changes and Error Corrections,” retrospective application of the change in accounting method is disclosed below.
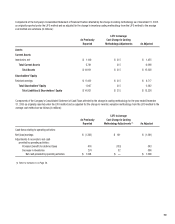
The effects of the change in methodology of costing U.S. inventories from LIFO to average cost on inventory and cost of goods sold for prior periods
presented are as follows (in millions):
As of and for the Year Ended As of and for the Year Ended
December 31, 2005 December 31, 2004
LIFO Method Average Cost Method LIFO Method Average Cost Method
Inventory $ 1,140 $ 1,455 $ 1,158 $ 1,506
Cost of goods sold $ 10,617 $ 10,650 $ 9,582 $ 9,601