Kodak 2006 Annual Report Download - page 45
Download and view the complete annual report
Please find page 45 of the 2006 Kodak annual report below. You can navigate through the pages in the report by either clicking on the pages listed below, or by using the keyword search tool below to find specific information within the annual report.-
 1
1 -
2
-
3
-
4
-
5
-
6
-
7
-
8
-
9
-
10
-
11
-
12
-
13
-
14
-
15
-
16
-
17
-
18
-
19
-
20
-
21
-
22
-
23
-
24
-
25
-
26
-
27
-
28
-
29
-
30
-
31
-
32
-
33
-
34
-
 35
35 -
 36
36 -
 37
37 -
 38
38 -
 39
39 -
 40
40 -
 41
41 -
 42
42 -
 43
43 -
 44
44 -
 45
45 -
 46
46 -
 47
47 -
 48
48 -
 49
49 -
 50
50 -
 51
51 -
 52
52 -
 53
53 -
 54
54 -
 55
55 -
56
-
57
-
58
-
59
-
60
-
61
-
62
-
63
-
64
-
65
-
66
-
67
-
68
-
69
-
70
-
71
-
72
-
73
-
74
-
75
-
76
-
77
-
78
-
79
-
80
-
81
-
82
-
83
-
84
-
85
-
86
-
87
-
88
-
89
-
90
-
91
-
92
-
93
-
94
-
95
-
96
-
97
-
98
-
99
-
100
-
101
-
102
-
103
-
104
-
105
-
106
-
107
-
108
-
109
-
110
-
111
-
112
-
113
-
114
-
115
-
116
-
117
-
118
-
119
-
120
-
121
-
122
-
123
-
124
-
125
-
126
-
127
-
128
-
129
-
130
-
131
-
132
-
133
-
134
-
135
-
136
-
137
-
138
-
139
-
140
-
141
-
142
-
143
-
144
-
145
-
146
-
147
-
148
-
149
-
150
-
151
-
152
-
153
-
154
-
155
-
156
-
157
-
158
-
159
-
160
-
161
-
162
-
163
-
164
-
165
-
166
-
167
-
168
-
169
-
170
-
171
-
172
-
173
-
174
-
175
-
176
-
177
-
178
-
179
-
180
-
181
-
182
-
183
-
184
-
185
-
186
-
187
-
188
-
189
-
190
-
191
-
192
-
193
-
194
-
195
-
196
-
197
-
198
-
199
-
200
-
201
-
202
-
203
-
204
-
205
-
206
-
207
-
208
-
209
-
210
-
211
-
212
-
213
-
214
-
215
-
216
-
217
-
218
-
219
-
220
-
221
-
222
-
223
-
224
-
225
-
226
-
227
-
228
-
229
-
230
-
231
-
232
-
233
-
234
-
235
-
236
 |
 |
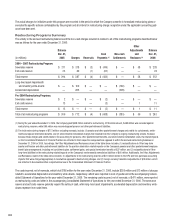
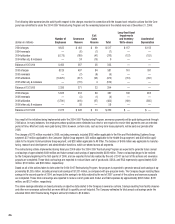
Company believes it is not more likely than not that the assets will be realized. The remaining net deferred tax assets in excess of the valuation allow-
ance of $79 million relate to certain foreign tax credit deferred tax assets which the Company believes it is more likely than not that the assets will be
realized.
Valuation Allowance – Outside the U.S.
As of December 31, 2005, the Company had a valuation allowance of approximately $212 million relating to its deferred tax assets outside of the U.S.
of $569 million. The valuation allowance of $212 million is attributable to certain net operating loss and capital loss carryforwards which the Company
believes it is not more likely than not that the assets will be realized.
(Loss) Earnings From Continuing Operations
The loss from continuing operations for 2005 was $1,354 million, or $4.70 per basic and diluted share, as compared with earnings from continuing
operations for 2004 of $69 million, or $.24 per basic and diluted share, representing a decrease of $1,423 million. This decrease in earnings from
continuing operations is attributable to the reasons described above.
Consumer Digital Imaging Group (CDG)
Worldwide Revenues
Net worldwide sales for the CDG segment were $3,215 million for 2005 as compared with $2,366 million for 2004, representing an increase of $849
million, or 36%. The increase in net sales was primarily attributable to volume increases, which increased net sales by approximately 53 percentage
points, partially offset by negative price/mix, which decreased net sales by approximately 17 percentage points. The volume increases were largely
driven by the consumer digital capture SPG and home printing solutions SPG. The negative price/mix impact was driven primarily by the home printing
solutions SPG and consumer digital capture SPG. Foreign exchange did not have a significant impact on net sales.
CDG segment net sales in the U.S. were $2,034 million for 2005 as compared with $1,440 million for 2004, representing an increase of $594 million,
or 41%. CDG segment net sales outside the U.S. were $1,181 million for 2005 as compared with $926 million for the 2004, representing an increase
of $255 million, or 28%, which includes a favorable impact from exchange of 1%.
Net worldwide sales of consumer digital capture products, which include consumer digital cameras, accessories, memory products, imaging sensors,
and intellectual property royalties, increased 30% in 2005 as compared with the prior year, primarily reflecting strong volume increases and favorable
exchange, partially offset by negative price/mix.
Net worldwide sales of picture maker kiosks/media (the kiosk SPG) increased 37% in 2005 as compared with 2004, as a result of strong volume
increases and favorable exchange. Sales continue to be driven by strong market acceptance of Kodak’s new generation of kiosks and an increase in
consumer demand for digital printing at retail.
Net worldwide sales of the home printing solutions SPG, which includes inkjet photo paper and printer docks/media, increased 57% in 2005 as com-
pared with 2004 driven by sales of printer docks and associated thermal media. For full year 2005, Kodak’s printer dock product held the number-one
market share position (on a unit basis) in the United States, Canada, Germany, Australia and the United Kingdom. However, inkjet paper sales in 2005
declined year over year, as volume growth was more than offset by lower pricing. Industry growth for inkjet paper continues to slow as a result of
improving retail printing solutions, and alternative home printing solutions.
Gross Profit
Gross profit for the CDG segment was $598 million for 2005 as compared with $463 million for the prior year period, representing an increase of
$135 million or 29%. The gross profit margin was 18.6% in 2005 as compared with 19.6% in 2004. The 1.0 percentage point decrease was primarily
attributable to negative price/mix, which reduced gross profit margins by approximately 10.4 percentage points. This decline from negative price/mix
was partially offset by positive results from initiatives to reduce manufacturing costs, which improved gross profit margins by approximately 8.0
percentage points; volume increases, which favorably impacted gross profit margins by approximately 1.2 percentage points; and foreign exchange,
which favorably impacted gross profit margins by approximately 0.1 percentage points. The negative price/mix impact was primarily driven by the
home printing solutions SPG and the consumer digital capture SPG, partially offset by the year-over-year increase in royalty income relating to digital
capture.
Selling, General and Administrative Expenses
SG&A expenses for the CDG segment increased $63 million, or 13%, from $488 million in 2004 to $551 million in 2005, and decreased as a percent-
age of sales from 21% for 2004 to 17% for 2005. The dollar increase is primarily attributable to increased advertising costs.
Research and Development Costs
R&D costs for the CDG segment increased $15 million, or 9%, from $164 million in 2004 to $179 million in 2005 and decreased as a percentage of
sales from 7% in 2004 to 6% in 2005.