Kodak 2006 Annual Report Download - page 40
Download and view the complete annual report
Please find page 40 of the 2006 Kodak annual report below. You can navigate through the pages in the report by either clicking on the pages listed below, or by using the keyword search tool below to find specific information within the annual report.-
 1
1 -
2
-
3
-
4
-
5
-
6
-
7
-
8
-
9
-
10
-
11
-
12
-
13
-
14
-
15
-
16
-
17
-
18
-
19
-
20
-
21
-
22
-
23
-
24
-
25
-
26
-
27
-
28
-
29
-
 30
30 -
 31
31 -
 32
32 -
 33
33 -
 34
34 -
 35
35 -
 36
36 -
 37
37 -
 38
38 -
 39
39 -
 40
40 -
 41
41 -
 42
42 -
 43
43 -
 44
44 -
 45
45 -
 46
46 -
 47
47 -
 48
48 -
 49
49 -
 50
50 -
51
-
52
-
53
-
54
-
55
-
56
-
57
-
58
-
59
-
60
-
61
-
62
-
63
-
64
-
65
-
66
-
67
-
68
-
69
-
70
-
71
-
72
-
73
-
74
-
75
-
76
-
77
-
78
-
79
-
80
-
81
-
82
-
83
-
84
-
85
-
86
-
87
-
88
-
89
-
90
-
91
-
92
-
93
-
94
-
95
-
96
-
97
-
98
-
99
-
100
-
101
-
102
-
103
-
104
-
105
-
106
-
107
-
108
-
109
-
110
-
111
-
112
-
113
-
114
-
115
-
116
-
117
-
118
-
119
-
120
-
121
-
122
-
123
-
124
-
125
-
126
-
127
-
128
-
129
-
130
-
131
-
132
-
133
-
134
-
135
-
136
-
137
-
138
-
139
-
140
-
141
-
142
-
143
-
144
-
145
-
146
-
147
-
148
-
149
-
150
-
151
-
152
-
153
-
154
-
155
-
156
-
157
-
158
-
159
-
160
-
161
-
162
-
163
-
164
-
165
-
166
-
167
-
168
-
169
-
170
-
171
-
172
-
173
-
174
-
175
-
176
-
177
-
178
-
179
-
180
-
181
-
182
-
183
-
184
-
185
-
186
-
187
-
188
-
189
-
190
-
191
-
192
-
193
-
194
-
195
-
196
-
197
-
198
-
199
-
200
-
201
-
202
-
203
-
204
-
205
-
206
-
207
-
208
-
209
-
210
-
211
-
212
-
213
-
214
-
215
-
216
-
217
-
218
-
219
-
220
-
221
-
222
-
223
-
224
-
225
-
226
-
227
-
228
-
229
-
230
-
231
-
232
-
233
-
234
-
235
-
236
 |
 |
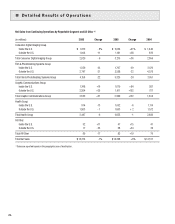
Digital Strategic Product Groups’ Revenues
The Graphic Communications Group segment digital product sales are comprised of the digital prepress consumables SPG; NexPress color SPG; com-
mercial inkjet printing solutions SPG; workflow and prepress systems SPG; and other digital SPGs.
Digital product sales for the Graphic Communications Group segment were $3,085 million for 2006 as compared with $2,437 million for the prior year,
representing an increase of $648 million, or 27%. The increase in digital product sales was primarily attributable to the acquisitions of KPG and Creo
in the prior year, which generated revenues in the workflow and prepress SPG and the digital prepress consumables SPG.
Net worldwide sales for the NexPress color SPG increased 41% driven by strong volume increases. Sales from NexPress color equipment and
consumables increased 50% from the prior year, while direct image press equipment sales declined 24% year-over-year. The installed base of digital
production color presses continues to grow, resulting in higher page volumes and increased consumables revenue.
Net worldwide sales of commercial inkjet printing solutions increased 3% year-over-year, reflecting volume increases for services and consumables,
partially offset by negative price/mix.
Net worldwide sales of other digital products and services decreased 6% year-over-year, primarily driven by volume declines. Sales declines for elec-
trophotographic black and white equipment and consumables, and wide-format inkjet, were partially offset by sales increases for document scanners.
Traditional Strategic Product Groups’ Revenues
Segment traditional product sales are primarily comprised of sales of traditional graphics products, including films, paper, media, equipment and
analog plates. These sales were $547 million for 2006 compared with $553 million for the prior year, representing a decrease of $6 million, or 1%.
The decrease in sales was primarily attributable to declines in analog plates and graphic films as the industry continues to transition to digital partially
offset by the impact of the acquisition of KPG in the prior year.
Gross Profit
Gross profit for the Graphic Communications Group segment was $1,034 million for 2006 as compared with $799 million in the prior year, represent-
ing an increase of $235 million, or 29%. This increase was primarily attributable to the acquisitions of KPG and Creo in 2005, which together contrib-
uted $197 million to the year-over-year increase in gross profit. The gross profit margin was 28.5% in 2006 as compared with 26.7% in the prior year
period. The increase in the gross profit margin of 1.8 percentage points was primarily attributable to favorable price/mix, which increased gross profit
margins by approximately 1.1 percentage points and was largely driven by the workflow and prepress SPG and the digital prepress consumables SPG.
Also contributing to the increase in gross profit margins were: (1) reductions in manufacturing and other costs, which increased gross profit margins
by approximately 0.4 percentage points, and (2) the acquisitions of Creo and KPG, which increased gross profit margins by approximately 0.6 percent-
age points. These increases were partially offset by unfavorable foreign exchange, which negatively impacted gross profit margins by approximately
0.4 percentage points. The impact from volume on gross profit margins was not significant.
Selling, General and Administrative Expenses
SG&A expenses for the Graphic Communications Group segment were $695 million for 2006 as compared with $562 million in the prior year, repre-
senting an increase of $133 million, or 24%, and remained constant as a percentage of sales at 19%. The increase in SG&A is primarily attributable
to $148 million of SG&A costs associated with the acquired KPG and Creo businesses, and redistribution of corporate costs associated with bringing
acquired businesses into the Kodak portfolio, partially offset by integration synergies.
Research and Development Costs
R&D costs for the Graphic Communications Group segment decreased $80 million, or 29%, from $278 million for 2005 to $198 million for 2006, and
decreased as a percentage of sales from 9% for 2005 to 5% for the current year. The decrease was primarily driven by $52 million of write-offs in
2005 for purchased in-process R&D associated with acquisitions, and was also driven by integration synergies.
Earnings (Loss) From Continuing Operations Before Interest, Other Income (Charges), Net and Income Taxes
Earnings from continuing operations before interest, other income (charges), net and income taxes for the Graphic Communications Group segment
were $141 million in 2006 compared with a loss of $41 million in 2005. This increase in earnings is attributable to the reasons outlined above.