Kodak 2006 Annual Report Download - page 110
Download and view the complete annual report
Please find page 110 of the 2006 Kodak annual report below. You can navigate through the pages in the report by either clicking on the pages listed below, or by using the keyword search tool below to find specific information within the annual report.-
 1
1 -
2
-
3
-
4
-
5
-
6
-
7
-
8
-
9
-
10
-
11
-
12
-
13
-
14
-
15
-
16
-
17
-
18
-
19
-
20
-
21
-
22
-
23
-
24
-
25
-
26
-
27
-
28
-
29
-
30
-
31
-
32
-
33
-
34
-
35
-
36
-
37
-
38
-
39
-
40
-
41
-
42
-
43
-
44
-
45
-
46
-
47
-
48
-
49
-
50
-
51
-
52
-
53
-
54
-
55
-
56
-
57
-
58
-
59
-
60
-
61
-
62
-
63
-
64
-
65
-
66
-
67
-
68
-
69
-
70
-
71
-
72
-
73
-
74
-
75
-
76
-
77
-
78
-
79
-
80
-
81
-
82
-
83
-
84
-
85
-
86
-
87
-
88
-
89
-
90
-
91
-
92
-
93
-
94
-
95
-
96
-
97
-
98
-
99
-
 100
100 -
 101
101 -
 102
102 -
 103
103 -
 104
104 -
 105
105 -
 106
106 -
 107
107 -
 108
108 -
 109
109 -
 110
110 -
 111
111 -
 112
112 -
 113
113 -
 114
114 -
 115
115 -
 116
116 -
 117
117 -
 118
118 -
 119
119 -
 120
120 -
121
-
122
-
123
-
124
-
125
-
126
-
127
-
128
-
129
-
130
-
131
-
132
-
133
-
134
-
135
-
136
-
137
-
138
-
139
-
140
-
141
-
142
-
143
-
144
-
145
-
146
-
147
-
148
-
149
-
150
-
151
-
152
-
153
-
154
-
155
-
156
-
157
-
158
-
159
-
160
-
161
-
162
-
163
-
164
-
165
-
166
-
167
-
168
-
169
-
170
-
171
-
172
-
173
-
174
-
175
-
176
-
177
-
178
-
179
-
180
-
181
-
182
-
183
-
184
-
185
-
186
-
187
-
188
-
189
-
190
-
191
-
192
-
193
-
194
-
195
-
196
-
197
-
198
-
199
-
200
-
201
-
202
-
203
-
204
-
205
-
206
-
207
-
208
-
209
-
210
-
211
-
212
-
213
-
214
-
215
-
216
-
217
-
218
-
219
-
220
-
221
-
222
-
223
-
224
-
225
-
226
-
227
-
228
-
229
-
230
-
231
-
232
-
233
-
234
-
235
-
236
 |
 |

0
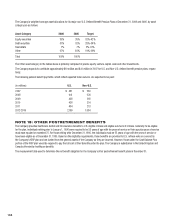
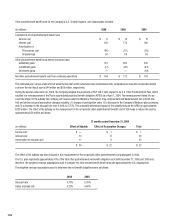
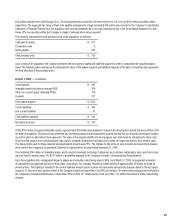
The weighted-average assumptions used to determine the benefit obligation amounts as of the end of the year for all major funded and unfunded U.S.
and Non-U.S. defined benefit plans were as follows:
2006 2005
U.S. Non-U.S. U.S. Non-U.S.
Discount rate 5.99% 5.00% 5.51% 4.51%
Salary increase rate 4.55% 3.20% 4.58% 3.67%
The weighted-average assumptions used to determine net pension (income) expense for all the major funded and unfunded U.S. and Non-U.S. defined
benefit plans were as follows:
2006 2005
U.S. Non-U.S. U.S. Non-U.S.
Discount rate 5.98% 4.78% 5.57% 4.85%
Salary increase rate 4.58% 3.67% 4.33% 3.29%
Expected long-term rate of return on plan assets 8.60% 7.99% 9.00% 8.12%
Of the total plan assets attributable to the major U.S. defined benefit plans at December 31, 2006 and 2005, 98% relate to the KRIP plan. The
expected long-term rate of return on plan assets assumption (EROA) is determined from the plan’s asset allocation using forward-looking assump-
tions in the context of historical returns, correlations and volatilities. The investment strategy underlying the asset allocation is to manage the assets of
the U.S. plans to provide for the long-term liabilities while maintaining sufficient liquidity to pay current benefits. This is primarily achieved by holding
equity-like investments while investing a portion of the assets in long duration bonds in order to provide for benefits included in the projected benefit
obligation. The Company undertakes an asset and liability modeling study once every three years or when there are material changes in the composi-
tion of the plan liability or capital markets. The Company completed its most recent study in 2005, which supports the EROA of 9%.
The expected return on plan assets for the major non-U.S. pension plans range from 3.74% to 9.00% for 2006. Every three years or when market
conditions have changed materially, the Company will undertake new asset and liability modeling studies for each of its larger pension plans. The
asset allocations and expected return on plan assets are individually set to provide for benefits included in the projected benefit obligation within each
country’s legal investment constraints. The investment strategy is to manage the assets of the non-U.S. plans to provide for the long-term liabilities
while maintaining sufficient liquidity to pay current benefits. This is primarily achieved by holding equity-like investments while investing a portion of
the assets in long duration bonds in order to partially match the long-term nature of the liabilities.
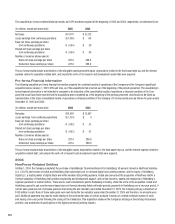
The Company’s weighted-average asset allocations for its major U.S. defined benefit pension plans at December 31, 2006 and 2005, by asset cat-
egory, are as follows:
Asset Category 2006 2005 Target
Equity securities 42% 42% 32%-42%
Debt securities 30% 31% 29%-34%
Real estate 5% 5% 3%-13%
Other 23% 22% 19%-29%
Total 100% 100%