Kodak 2006 Annual Report Download - page 56
Download and view the complete annual report
Please find page 56 of the 2006 Kodak annual report below. You can navigate through the pages in the report by either clicking on the pages listed below, or by using the keyword search tool below to find specific information within the annual report.-
 1
1 -
2
-
3
-
4
-
5
-
6
-
7
-
8
-
9
-
10
-
11
-
12
-
13
-
14
-
15
-
16
-
17
-
18
-
19
-
20
-
21
-
22
-
23
-
24
-
25
-
26
-
27
-
28
-
29
-
30
-
31
-
32
-
33
-
34
-
35
-
36
-
37
-
38
-
39
-
40
-
41
-
42
-
43
-
44
-
45
-
 46
46 -
 47
47 -
 48
48 -
 49
49 -
 50
50 -
 51
51 -
 52
52 -
 53
53 -
 54
54 -
 55
55 -
 56
56 -
 57
57 -
 58
58 -
 59
59 -
 60
60 -
 61
61 -
 62
62 -
 63
63 -
 64
64 -
 65
65 -
 66
66 -
67
-
68
-
69
-
70
-
71
-
72
-
73
-
74
-
75
-
76
-
77
-
78
-
79
-
80
-
81
-
82
-
83
-
84
-
85
-
86
-
87
-
88
-
89
-
90
-
91
-
92
-
93
-
94
-
95
-
96
-
97
-
98
-
99
-
100
-
101
-
102
-
103
-
104
-
105
-
106
-
107
-
108
-
109
-
110
-
111
-
112
-
113
-
114
-
115
-
116
-
117
-
118
-
119
-
120
-
121
-
122
-
123
-
124
-
125
-
126
-
127
-
128
-
129
-
130
-
131
-
132
-
133
-
134
-
135
-
136
-
137
-
138
-
139
-
140
-
141
-
142
-
143
-
144
-
145
-
146
-
147
-
148
-
149
-
150
-
151
-
152
-
153
-
154
-
155
-
156
-
157
-
158
-
159
-
160
-
161
-
162
-
163
-
164
-
165
-
166
-
167
-
168
-
169
-
170
-
171
-
172
-
173
-
174
-
175
-
176
-
177
-
178
-
179
-
180
-
181
-
182
-
183
-
184
-
185
-
186
-
187
-
188
-
189
-
190
-
191
-
192
-
193
-
194
-
195
-
196
-
197
-
198
-
199
-
200
-
201
-
202
-
203
-
204
-
205
-
206
-
207
-
208
-
209
-
210
-
211
-
212
-
213
-
214
-
215
-
216
-
217
-
218
-
219
-
220
-
221
-
222
-
223
-
224
-
225
-
226
-
227
-
228
-
229
-
230
-
231
-
232
-
233
-
234
-
235
-
236
 |
 |
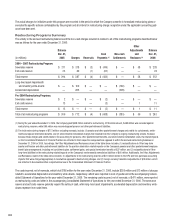
items of income and expense) ratio of not greater than: 3.50 to 1 as of December 31, 2006 and thereafter, and (2) a consolidated EBITDA to consoli-
dated interest expense (subject to adjustments to exclude interest expense not related to borrowed money) ratio, on a rolling four-quarter basis, of no
less than 3 to 1. As of December 31, 2006, the Company was in compliance with all covenants under the Secured Credit Agreement.
As of December 31, 2006, the Company’s consolidated debt to EBITDA ratio was 1.92 and the consolidated EBITDA to consolidated interest ratio
was 6.07. Consolidated EBITDA and consolidated interest expense, as adjusted, are non-GAAP financial measures. The Company believes that the pre-
sentation of the consolidated debt to EBITDA and EBITDA to consolidated interest expense financial measures is useful information to investors, as it
provides information as to how the Company actually performed against the financial requirements under the Secured Credit Facilities, and how much
headroom the Company has within these covenants.
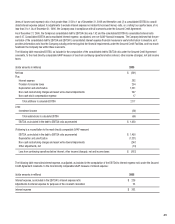
The following table reconciles EBITDA, as included in the computation of the consolidated debt to EBITDA ratio under the Secured Credit Agreement
covenants, to the most directly comparable GAAP measure of loss from continuing operations before interest, other income (charges), net and income
taxes:
(dollar amounts in millions) 2006
Net loss $ (601)
Plus:
Interest expense 262
Provision for income taxes 254
Depreciation and amortization 1,331
Non-cash restructuring charges and asset write-downs/impairments 247
Non-cash stock compensation expense 17
Total additions to calculate EBITDA 2,111
Less:
Investment income (60)
Total subtractions to calculate EBITDA (60)
EBITDA, as included in the debt to EBITDA ratio as presented $ 1,450
(Following is a reconciliation to the most directly comparable GAAP measure)
EBITDA, as included in the debt to EBITDA ratio as presented $ 1,450
Depreciation and amortization (1,331)
Non-cash restructuring charges and asset write-downs/impairments (247)
Other adjustments, net (74)
Loss from continuing operations before interest, other income (charges), net and income taxes $ (202)
The following table reconciles interest expense, as adjusted, as included in the computation of the EBITDA to interest expense ratio under the Secured
Credit Agreement covenants, to the most directly comparable GAAP measure of interest expense:
(dollar amounts in millions) 2006
Interest expense, as included in the EBITDA to interest expense ratio $ 239
Adjustments to interest expense for purposes of the covenant calculation 23
Interest expense $ 262