Kodak 2006 Annual Report Download - page 41
Download and view the complete annual report
Please find page 41 of the 2006 Kodak annual report below. You can navigate through the pages in the report by either clicking on the pages listed below, or by using the keyword search tool below to find specific information within the annual report.-
 1
1 -
2
-
3
-
4
-
5
-
6
-
7
-
8
-
9
-
10
-
11
-
12
-
13
-
14
-
15
-
16
-
17
-
18
-
19
-
20
-
21
-
22
-
23
-
24
-
25
-
26
-
27
-
28
-
29
-
30
-
 31
31 -
 32
32 -
 33
33 -
 34
34 -
 35
35 -
 36
36 -
 37
37 -
 38
38 -
 39
39 -
 40
40 -
 41
41 -
 42
42 -
 43
43 -
 44
44 -
 45
45 -
 46
46 -
 47
47 -
 48
48 -
 49
49 -
 50
50 -
 51
51 -
52
-
53
-
54
-
55
-
56
-
57
-
58
-
59
-
60
-
61
-
62
-
63
-
64
-
65
-
66
-
67
-
68
-
69
-
70
-
71
-
72
-
73
-
74
-
75
-
76
-
77
-
78
-
79
-
80
-
81
-
82
-
83
-
84
-
85
-
86
-
87
-
88
-
89
-
90
-
91
-
92
-
93
-
94
-
95
-
96
-
97
-
98
-
99
-
100
-
101
-
102
-
103
-
104
-
105
-
106
-
107
-
108
-
109
-
110
-
111
-
112
-
113
-
114
-
115
-
116
-
117
-
118
-
119
-
120
-
121
-
122
-
123
-
124
-
125
-
126
-
127
-
128
-
129
-
130
-
131
-
132
-
133
-
134
-
135
-
136
-
137
-
138
-
139
-
140
-
141
-
142
-
143
-
144
-
145
-
146
-
147
-
148
-
149
-
150
-
151
-
152
-
153
-
154
-
155
-
156
-
157
-
158
-
159
-
160
-
161
-
162
-
163
-
164
-
165
-
166
-
167
-
168
-
169
-
170
-
171
-
172
-
173
-
174
-
175
-
176
-
177
-
178
-
179
-
180
-
181
-
182
-
183
-
184
-
185
-
186
-
187
-
188
-
189
-
190
-
191
-
192
-
193
-
194
-
195
-
196
-
197
-
198
-
199
-
200
-
201
-
202
-
203
-
204
-
205
-
206
-
207
-
208
-
209
-
210
-
211
-
212
-
213
-
214
-
215
-
216
-
217
-
218
-
219
-
220
-
221
-
222
-
223
-
224
-
225
-
226
-
227
-
228
-
229
-
230
-
231
-
232
-
233
-
234
-
235
-
236
 |
 |
Health Group
Worldwide Revenues
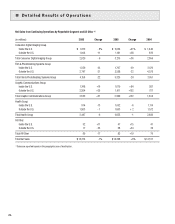
Net worldwide sales for the Health Group segment were $2,497 million for 2006 as compared with $2,655 million for the prior year, representing
a decrease of $158 million, or 6%. The decrease in sales was attributable to declines in volume of approximately 5.6 percentage points, primarily
driven by the digital output and radiology film SPGs, partially offset by the growth in the digital capture, and healthcare information SPGs. Unfavorable
price/mix reduced sales by approximately 0.8 percentage points, primarily driven by the digital capture SPG and digital output SPG, partially offset by
favorable price/mix in the dental SPG. These decreases were partially offset by favorable foreign exchange, which increased sales by approximately
0.4 percentage points.
Net sales in the U.S. were $914 million for 2006 as compared with $1,052 million for 2005, representing a decrease of $138 million, or 13%. Net
sales outside the U.S. were $1,583 million for 2006 as compared with $1,603 million for the prior year, representing a decrease of $20 million, or 1%.
Digital Strategic Product Groups’ Revenues
Health Group segment digital sales, which include digital output (DryView laser imagers/media and wet laser printers/media), digital capture systems
(computed radiography and digital radiography equipment), digital dental systems (practice management software and digital and computed radiog-
raphy capture equipment), healthcare information solutions (Picture Archiving and Communications Systems (PACS), Radiology Information Systems
(RIS) and Information Management Solutions (IMS)), and associated services were $1,682 million for 2006 as compared with $1,719 million for 2005,
representing a decrease of $37 million, or 2%. This sales decline was driven by lower revenues in the digital output SPG, partially offset by growth in
the digital capture SPG, digital dental SPG, and healthcare information solutions SPG.
Traditional Strategic Product Groups’ Revenues
Segment traditional product sales, including analog and dental film, equipment, service, and chemistry, were $815 million for 2006 as compared with
$936 million for 2005, representing a decrease of $121 million, or 13%. This decline was largely driven by declines in traditional radiology film sales.
Gross Profit
Gross profit for the Health Group segment was $912 million for 2006 as compared with $1,021 million in the prior year, representing a decrease of
$109 million, or 11%. The gross profit margin was 36.5% in 2006 as compared with 38.5% in the prior year. The decrease in the gross profit margin
of 2.0 percentage points was principally attributable to: (1) unfavorable price/mix, which negatively impacted gross profit margins by approximately
2.0 percentage points, primarily driven by the digital capture SPG, and (2) volume declines, which reduced gross profit margins by approximately 0.2
percentage points, primarily driven by the digital output and radiology film SPGs. These declines were partially offset by favorable foreign exchange,
which positively impacted gross profit margins by approximately 0.3 percentage points. The impact of manufacturing costs did not have a significant
impact on gross profit margin, as higher silver and raw material costs were more than offset by cost reduction activities and operational improvements.
Selling, General and Administrative Expenses
SG&A expenses for the Health Group segment increased $8 million, or 2%, from $489 million in 2005 to $497 million for the current year, and
increased as a percentage of sales from 18% in 2005 to 20% in the current year. The increase in SG&A expenses is primarily attributable to $37
million of costs related to the exploration of strategic alternatives for the Health Group, which was announced on May 4, 2006, partially offset by a
favorable legal settlement in the second quarter of 2006 and other cost reductions. The Company announced on January 10, 2007 that it has reached
an agreement to sell the Health Group to Onex Corporation for as much as $2.55 billion. The transaction is expected to close in the first half of 2007.
Research and Development Costs
R&D costs for 2006 decreased $24 million, or 15%, from $162 million in 2005 to $138 million, and remained constant as a percentage of sales at
6%. This decrease was primarily driven by cost reduction actions implemented in March 2006, which have been primarily focused on the digital out-
put and digital capture SPGs, to reduce overall R&D spending for the Health Group. The year-over-year decrease was also partially due to the write-off
of $2 million of purchased in-process R&D in 2005 related to the acquisition of Orex Computed Radiography Ltd.
Earnings From Continuing Operations Before Interest, Other Income (Charges), Net and Income Taxes
Earnings from continuing operations before interest, other income (charges), net and income taxes for the Health segment decreased $92 million, or
25%, from $370 million for 2005 to $278 million for 2006 due to the reasons described above.
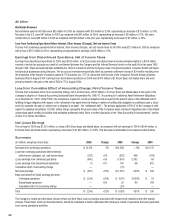
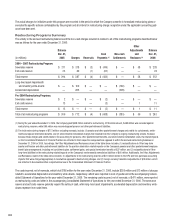
All Other
Worldwide Revenues
Net worldwide sales for All Other were $69 million for 2006 as compared with $83 million for 2005, representing a decrease of $14 million, or 17%.
Net sales in the U.S. were $52 million for 2006 as compared with $47 million for the prior year, representing an increase of $5 million, or 11%. Net
sales outside the U.S. were $17 million in 2006 as compared with $36 million in the prior year, representing a decrease of $19 million, or 53%.