Kodak 2006 Annual Report Download - page 53
Download and view the complete annual report
Please find page 53 of the 2006 Kodak annual report below. You can navigate through the pages in the report by either clicking on the pages listed below, or by using the keyword search tool below to find specific information within the annual report.-
 1
1 -
2
-
3
-
4
-
5
-
6
-
7
-
8
-
9
-
10
-
11
-
12
-
13
-
14
-
15
-
16
-
17
-
18
-
19
-
20
-
21
-
22
-
23
-
24
-
25
-
26
-
27
-
28
-
29
-
30
-
31
-
32
-
33
-
34
-
35
-
36
-
37
-
38
-
39
-
40
-
41
-
42
-
 43
43 -
 44
44 -
 45
45 -
 46
46 -
 47
47 -
 48
48 -
 49
49 -
 50
50 -
 51
51 -
 52
52 -
 53
53 -
 54
54 -
 55
55 -
 56
56 -
 57
57 -
 58
58 -
 59
59 -
 60
60 -
 61
61 -
 62
62 -
 63
63 -
64
-
65
-
66
-
67
-
68
-
69
-
70
-
71
-
72
-
73
-
74
-
75
-
76
-
77
-
78
-
79
-
80
-
81
-
82
-
83
-
84
-
85
-
86
-
87
-
88
-
89
-
90
-
91
-
92
-
93
-
94
-
95
-
96
-
97
-
98
-
99
-
100
-
101
-
102
-
103
-
104
-
105
-
106
-
107
-
108
-
109
-
110
-
111
-
112
-
113
-
114
-
115
-
116
-
117
-
118
-
119
-
120
-
121
-
122
-
123
-
124
-
125
-
126
-
127
-
128
-
129
-
130
-
131
-
132
-
133
-
134
-
135
-
136
-
137
-
138
-
139
-
140
-
141
-
142
-
143
-
144
-
145
-
146
-
147
-
148
-
149
-
150
-
151
-
152
-
153
-
154
-
155
-
156
-
157
-
158
-
159
-
160
-
161
-
162
-
163
-
164
-
165
-
166
-
167
-
168
-
169
-
170
-
171
-
172
-
173
-
174
-
175
-
176
-
177
-
178
-
179
-
180
-
181
-
182
-
183
-
184
-
185
-
186
-
187
-
188
-
189
-
190
-
191
-
192
-
193
-
194
-
195
-
196
-
197
-
198
-
199
-
200
-
201
-
202
-
203
-
204
-
205
-
206
-
207
-
208
-
209
-
210
-
211
-
212
-
213
-
214
-
215
-
216
-
217
-
218
-
219
-
220
-
221
-
222
-
223
-
224
-
225
-
226
-
227
-
228
-
229
-
230
-
231
-
232
-
233
-
234
-
235
-
236
 |
 |

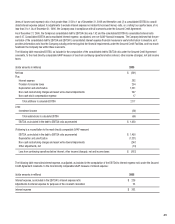
The following table summarizes the activity with respect to the charges recorded in connection with the focused cost reduction actions that the Com-
pany has committed to under the 2004-2007 Restructuring Program and the remaining balances in the related reserves at December 31, 2006:
Long-lived Asset
Exit Impairments
Number of Severance Costs and Inventory Accelerated
(dollars in millions) Employees Reserve Reserve Total Write-downs Depreciation
2004 charges 9,625 $ 418 $ 99 $ 517 $ 157 $ 152
2004 reversals — (6) (1) (7) — —
2004 utilization (5,175) (169) (47) (216) (157) (152)
2004 other adj. & reclasses — 24 (15) 9 — —
Balance at 12/31/04 4,450 267 36 303 — —
2005 charges 8,125 497 84 581 161 391
2005 reversals — (3) (6) (9) — —
2005 utilization (10,225) (377) (95) (472) (161) (391)
2005 other adj. & reclasses — (113) 4 (109) — —
Balance at 12/31/05 2,350 271 23 294 — —
2006 charges 5,625 318 69 387 100 285
2006 reversals — (3) (1) (4) — —
2006 utilization (5,700) (416) (67) (483) (100) (285)
2006 other adj. & reclasses — 58 — 58 — —
Balance at 12/31/06 2,275 $ 228 $ 24 $ 252 $ — $ —
As a result of the initiatives being implemented under the 2004-2007 Restructuring Program, severance payments will be paid during periods through
2008 since, in many instances, the employees whose positions were eliminated can elect or are required to receive their payments over an extended
period of time. Most exit costs were paid during 2006. However, certain costs, such as long-term lease payments, will be paid over periods after
2006.
The charges of $772 million recorded in 2006, excluding reversals, included $158 million applicable to the Film and Photofinishing Systems Group
segment, $27 million applicable to the Consumer Digital Group segment, $22 million applicable to the Health Group segment, and $38 million appli-
cable to the Graphic Communications Group segment, and $28 million applicable to All Other. The balance of $499 million was applicable to manufac-
turing, research and development, and administrative functions, which are shared across all segments.
The restructuring actions implemented during fiscal year 2006 under the 2004-2007 Restructuring Program are expected to generate future annual
cost savings of approximately $400 million and future annual cash savings of approximately $380 million. These cost savings began to be realized
by the Company beginning in the first quarter of 2006, and are expected to be fully realized by the end of 2007 as most of the actions and severance
payouts are completed. These total cost savings are expected to reduce future cost of goods sold, SG&A, and R&D expenses by approximately $231
million, $132 million, and $38 million, respectively.
Based on all of the actions taken to date under the 2004-2007 Restructuring Program, the program is expected to generate annual cost savings of ap-
proximately $1,385 million, including annual cash savings of $1,331 million, as compared with pre-program levels. The Company began realizing these
savings in the second quarter of 2004, and expects the savings to be fully realized by the end of 2007 as most of the actions and severance payouts
are completed. These total cost savings are expected to reduce cost of goods sold, SG&A, and R&D expenses by approximately $897 million, $351
million, and $137 million, respectively.
The above savings estimates are based primarily on objective data related to the Company’s severance actions. Savings resulting from facility closures
and other non-severance actions that are more difficult to quantify are not included. The Company estimates its total annual cost savings under the
extended 2004-2007 Restructuring Program will be $1.6 billion to $1.8 billion.