Kodak 2006 Annual Report Download - page 43
Download and view the complete annual report
Please find page 43 of the 2006 Kodak annual report below. You can navigate through the pages in the report by either clicking on the pages listed below, or by using the keyword search tool below to find specific information within the annual report.-
 1
1 -
2
-
3
-
4
-
5
-
6
-
7
-
8
-
9
-
10
-
11
-
12
-
13
-
14
-
15
-
16
-
17
-
18
-
19
-
20
-
21
-
22
-
23
-
24
-
25
-
26
-
27
-
28
-
29
-
30
-
31
-
32
-
 33
33 -
 34
34 -
 35
35 -
 36
36 -
 37
37 -
 38
38 -
 39
39 -
 40
40 -
 41
41 -
 42
42 -
 43
43 -
 44
44 -
 45
45 -
 46
46 -
 47
47 -
 48
48 -
 49
49 -
 50
50 -
 51
51 -
 52
52 -
 53
53 -
54
-
55
-
56
-
57
-
58
-
59
-
60
-
61
-
62
-
63
-
64
-
65
-
66
-
67
-
68
-
69
-
70
-
71
-
72
-
73
-
74
-
75
-
76
-
77
-
78
-
79
-
80
-
81
-
82
-
83
-
84
-
85
-
86
-
87
-
88
-
89
-
90
-
91
-
92
-
93
-
94
-
95
-
96
-
97
-
98
-
99
-
100
-
101
-
102
-
103
-
104
-
105
-
106
-
107
-
108
-
109
-
110
-
111
-
112
-
113
-
114
-
115
-
116
-
117
-
118
-
119
-
120
-
121
-
122
-
123
-
124
-
125
-
126
-
127
-
128
-
129
-
130
-
131
-
132
-
133
-
134
-
135
-
136
-
137
-
138
-
139
-
140
-
141
-
142
-
143
-
144
-
145
-
146
-
147
-
148
-
149
-
150
-
151
-
152
-
153
-
154
-
155
-
156
-
157
-
158
-
159
-
160
-
161
-
162
-
163
-
164
-
165
-
166
-
167
-
168
-
169
-
170
-
171
-
172
-
173
-
174
-
175
-
176
-
177
-
178
-
179
-
180
-
181
-
182
-
183
-
184
-
185
-
186
-
187
-
188
-
189
-
190
-
191
-
192
-
193
-
194
-
195
-
196
-
197
-
198
-
199
-
200
-
201
-
202
-
203
-
204
-
205
-
206
-
207
-
208
-
209
-
210
-
211
-
212
-
213
-
214
-
215
-
216
-
217
-
218
-
219
-
220
-
221
-
222
-
223
-
224
-
225
-
226
-
227
-
228
-
229
-
230
-
231
-
232
-
233
-
234
-
235
-
236
 |
 |
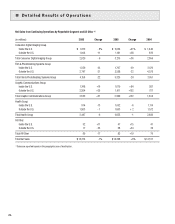
Traditional Strategic Product Groups’ Revenues
Net sales of the Company’s traditional products were $6,840 million for 2005 as compared with $8,364 million for the prior year, representing a
decrease of $1,524 million, or 18%, primarily driven by declines in the film capture SPG, the photofinishing services SPG, and the consumer output SPG.
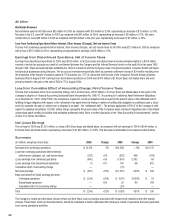
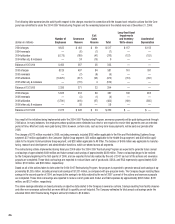
Foreign Revenues
The Company’s operations outside the U.S. are reported in three regions: (1) the Europe, Africa and Middle East region (EAMER), (2) the Asia Pacific
region, and (3) the Canada and Latin America region. Net sales in EAMER were $4,223 million for 2005 as compared with $4,038 million for 2004,
representing an increase of $185 million, or 5%, which includes an insignificant impact from exchange. Net sales in the Asia Pacific region were
$2,652 million for 2005 as compared with $2,549 million for 2004, representing an increase of $103 million, or 4%, which includes a favorable
impact from exchange of 1%. Net sales in the Canada and Latin America region were $1,414 million for 2005 as compared with $1,272 million for
2004, representing an increase of $142 million, or 11%, which includes a favorable impact from exchange of 2%.
Gross Profit
Gross profit was $3,618 million for 2005 as compared with $3,916 million for 2004, representing a decrease of $298 million, or 8%. The gross profit
margin was 25.4% in 2005 as compared with 29.0% in 2004. The 3.6 percentage point decrease was primarily attributable to: (1) price/mix, which
reduced gross profit margins by approximately 3.7 percentage points, (2) declines in volumes, which reduced gross profit margins by approximately
0.1 percentage points, and (3) manufacturing costs, which reduced gross profit margins by approximately 0.2 percentage points. The negative price/
mix impact was primarily driven by consumer digital cameras, one-time-use cameras, traditional consumer and digital health products and services,
partially offset by the year-over-year increase in royalty income relating to digital capture. These decreases were partially offset by exchange, which
favorably impacted gross profit margins by approximately 0.4 percentage points.
Included in 2005 manufacturing costs is $139 million of additional depreciation expense related to the change in estimate of the useful lives of
production machinery and equipment as a result of the faster-than-expected decline in the Company’s traditional film and paper business. During the
third quarter of 2005, the Company revised the useful lives of production machinery and equipment from 3-20 years to 3-5 years and manufacturing-
related buildings from 10-40 years to 5-20 years. Also included in 2005 manufacturing costs were accelerated depreciation charges of $391 million
related to the 2004-2007 Restructuring Program, compared with accelerated depreciation charges of $152 million in 2004.
Selling, General and Administrative Expenses
SG&A expenses were $2,668 million for 2005 as compared with $2,491 million for 2004, representing an increase of $177 million, or 7%. SG&A
increased as a percentage of sales from 18% for 2004 to 19% for 2005. The increase in SG&A was primarily attributable to SG&A related to acquisi-
tions of $293 million, unfavorable legal settlements totaling $21 million, and unfavorable exchange of $6 million, partially offset by cost reduction
initiatives.
Research and Development Costs
R&D costs were $892 million for 2005 as compared with $836 million for 2004, representing an increase of $56 million, or 7%. R&D as a percent-
age of sales remained unchanged at 6%. The dollar increase in R&D was primarily attributable to write-offs for purchased in-process R&D associated
with acquisitions made in 2005 for $54 million and increases in R&D spend related to newly-acquired businesses of $95 million, partially offset by
significant reductions in R&D spending related to traditional products.
Restructuring Costs and Other
Restructuring costs and other were $690 million for 2005 as compared with $695 million for 2004, representing a decrease of $5 million or 1%.
Loss from Continuing Operations Before Interest, Other Income (Charges), Net and Income Taxes
The loss from continuing operations before interest, other income (charges), net and income taxes for 2005 was $632 million as compared with a loss
of $106 million for 2004, representing an increase in the loss of $526 million. This increase was attributable to the reasons described above.
Interest Expense
Interest expense for 2005 was $211 million as compared with $168 million in the prior year. This increase is related to higher interest rates in 2005
and higher debt levels in 2005 as a result of borrowings to finance acquisitions.
Other Income (Charges), Net
The other income (charges), net component includes investment income, income and losses from equity investments, foreign exchange, and gains
and losses on the sales of assets and investments. Other income for 2005 was $44 million as compared with other income of $161 million for 2004.
The decline of $117 million is primarily attributable to proceeds from two favorable legal settlements totaling $101 million in 2004, with no similar
favorable legal settlements in 2005. Also contributing to the decline for 2005 was a loss on foreign exchange of $31 million due to the unhedged U.S.
dollar denominated note payable outside of the U.S. relating to the KPG acquisition versus foreign exchange losses of $10 million in 2004. On July 28,
2005, the Company entered into currency forward hedge contracts that will substantially offset foreign exchange gains or losses arising from this note
payable.