Kodak 2006 Annual Report Download - page 46
Download and view the complete annual report
Please find page 46 of the 2006 Kodak annual report below. You can navigate through the pages in the report by either clicking on the pages listed below, or by using the keyword search tool below to find specific information within the annual report.-
 1
1 -
2
-
3
-
4
-
5
-
6
-
7
-
8
-
9
-
10
-
11
-
12
-
13
-
14
-
15
-
16
-
17
-
18
-
19
-
20
-
21
-
22
-
23
-
24
-
25
-
26
-
27
-
28
-
29
-
30
-
31
-
32
-
33
-
34
-
35
-
 36
36 -
 37
37 -
 38
38 -
 39
39 -
 40
40 -
 41
41 -
 42
42 -
 43
43 -
 44
44 -
 45
45 -
 46
46 -
 47
47 -
 48
48 -
 49
49 -
 50
50 -
 51
51 -
 52
52 -
 53
53 -
 54
54 -
 55
55 -
 56
56 -
57
-
58
-
59
-
60
-
61
-
62
-
63
-
64
-
65
-
66
-
67
-
68
-
69
-
70
-
71
-
72
-
73
-
74
-
75
-
76
-
77
-
78
-
79
-
80
-
81
-
82
-
83
-
84
-
85
-
86
-
87
-
88
-
89
-
90
-
91
-
92
-
93
-
94
-
95
-
96
-
97
-
98
-
99
-
100
-
101
-
102
-
103
-
104
-
105
-
106
-
107
-
108
-
109
-
110
-
111
-
112
-
113
-
114
-
115
-
116
-
117
-
118
-
119
-
120
-
121
-
122
-
123
-
124
-
125
-
126
-
127
-
128
-
129
-
130
-
131
-
132
-
133
-
134
-
135
-
136
-
137
-
138
-
139
-
140
-
141
-
142
-
143
-
144
-
145
-
146
-
147
-
148
-
149
-
150
-
151
-
152
-
153
-
154
-
155
-
156
-
157
-
158
-
159
-
160
-
161
-
162
-
163
-
164
-
165
-
166
-
167
-
168
-
169
-
170
-
171
-
172
-
173
-
174
-
175
-
176
-
177
-
178
-
179
-
180
-
181
-
182
-
183
-
184
-
185
-
186
-
187
-
188
-
189
-
190
-
191
-
192
-
193
-
194
-
195
-
196
-
197
-
198
-
199
-
200
-
201
-
202
-
203
-
204
-
205
-
206
-
207
-
208
-
209
-
210
-
211
-
212
-
213
-
214
-
215
-
216
-
217
-
218
-
219
-
220
-
221
-
222
-
223
-
224
-
225
-
226
-
227
-
228
-
229
-
230
-
231
-
232
-
233
-
234
-
235
-
236
 |
 |
Loss From Continuing Operations Before Interest, Other Income (Charges), Net and Income Taxes
The loss from continuing operations before interest, other income (charges), net and income taxes for the CDG segment was $131 million in 2005
compared with a loss of $189 million in 2004, representing an improvement in earnings of $58 million or 31%, as a result of the factors described
above.
Film and Photofinishing Systems Group (FPG)
Worldwide Revenues
Net worldwide sales for the FPG segment were $5,325 million for 2005 as compared with $7,051 million for 2004, representing a decrease of $1,726
million, or 24%. The decrease in net sales was primarily attributable to volume declines (primarily in the consumer film capture SPG, the photofinish-
ing services SPG, and the consumer output SPG), which decreased sales by approximately 23.1 percentage points. Negative price/mix, largely driven
by the consumer film capture SPG and the consumer output SPG, decreased sales by approximately 2.0 percentage points. These declines were
partially offset by favorable exchange, which increased net sales by approximately 0.7 percentage points.
FPG segment net sales in the U.S. were $1,767 million for 2005 as compared with $2,476 million for 2004, representing a decrease of $709 million,
or 29%. FPG segment net sales outside the U.S. were $3,558 million for 2005 as compared with $4,575 million for 2004, representing a decrease of
$1,017 million, or 22%, which includes a favorable impact from exchange of 1%.
Net worldwide sales of the film capture SPG, including consumer roll film (35mm and APS film), one-time-use cameras (OTUC), professional films,
reloadable traditional film cameras and batteries/videotape, decreased 31% in 2005 as compared with 2004, primarily reflecting volume declines and
negative price/mix, partially offset by favorable exchange.
Net worldwide sales for the consumer and professional output SPGs, which include color negative paper and photochemicals, decreased 19% in 2005
as compared with 2004, primarily reflecting volume declines and unfavorable price/mix, partially offset by favorable exchange. The volume declines
are largely driven by the substantial reduction of direct sales of minilab equipment, which began in the third quarter of 2005, as the Company has
shifted its focus to providing minilab services.
Net worldwide sales for the photofinishing services SPG, which includes equipment and photofinishing services at retail on-site and Qualex in the U.S.
and CIS (Consumer Imaging Services) outside the U.S., decreased 47% in 2005 as compared with 2004, reflecting continuing volume declines in the
development and processing of consumer films.
Net worldwide sales for the entertainment film SPGs, including origination and print films for the entertainment industry increased 1%, primarily
reflecting volume increases and favorable exchange, partially offset by overall negative price/mix.
Gross Profit
Gross profit for the FPG segment was $1,630 million for 2005 as compared with $2,176 million for the prior year period, representing a decrease of
$546 million or 25%. The gross profit margin was 30.6% in 2005 as compared with 30.9% in 2004. The 0.3 percentage point decrease was primarily
attributable to increased manufacturing costs, which negatively impacted gross profit margins by approximately 0.6 percentage points, and volume
declines, which negatively impacted gross profit margins by approximately 0.5 percentage points. These declines were partially offset by favorable
exchange, which positively impacted gross profit margins by approximately 0.6 percentage points, and positive price/mix, which positively impacted
gross profit margins by approximately 0.2 percentage points.
Selling, General and Administrative Expenses
SG&A expenses for the FPG segment decreased $166 million, or 14%, from $1,167 million in 2004 to $1,001 million in 2005, and increased as a
percentage of sales from 17% for 2004 to 19% for 2005. The dollar decrease is primarily attributable to cost reduction actions. These cost reduction
actions are being outpaced by the decline of traditional product sales, which resulted in a minor year-over-year increase of SG&A as a percentage of
sales.
Research and Development Costs
R&D costs for the FPG segment decreased $66 million, or 43%, from $155 million in 2004 to $89 million in 2005 and remained constant as a per-
centage of sales at 2%. The decrease in R&D was primarily attributable to spending reductions related to traditional products and services.
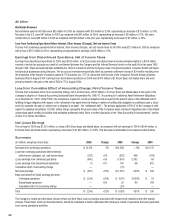
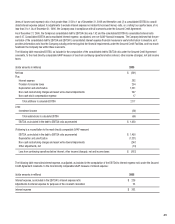
Earnings From Continuing Operations Before Interest, Other Income (Charges), Net and Income Taxes
Earnings from continuing operations before interest, other income (charges), net and income taxes for the FPG segment were $540 million in 2005
compared with $854 million in 2004, representing a decrease of $314 million or 37%, as a result of the factors described above.