Kodak 2006 Annual Report Download - page 75
Download and view the complete annual report
Please find page 75 of the 2006 Kodak annual report below. You can navigate through the pages in the report by either clicking on the pages listed below, or by using the keyword search tool below to find specific information within the annual report.-
 1
1 -
2
-
3
-
4
-
5
-
6
-
7
-
8
-
9
-
10
-
11
-
12
-
13
-
14
-
15
-
16
-
17
-
18
-
19
-
20
-
21
-
22
-
23
-
24
-
25
-
26
-
27
-
28
-
29
-
30
-
31
-
32
-
33
-
34
-
35
-
36
-
37
-
38
-
39
-
40
-
41
-
42
-
43
-
44
-
45
-
46
-
47
-
48
-
49
-
50
-
51
-
52
-
53
-
54
-
55
-
56
-
57
-
58
-
59
-
60
-
61
-
62
-
63
-
64
-
 65
65 -
 66
66 -
 67
67 -
 68
68 -
 69
69 -
 70
70 -
 71
71 -
 72
72 -
 73
73 -
 74
74 -
 75
75 -
 76
76 -
 77
77 -
 78
78 -
 79
79 -
 80
80 -
 81
81 -
 82
82 -
 83
83 -
 84
84 -
 85
85 -
86
-
87
-
88
-
89
-
90
-
91
-
92
-
93
-
94
-
95
-
96
-
97
-
98
-
99
-
100
-
101
-
102
-
103
-
104
-
105
-
106
-
107
-
108
-
109
-
110
-
111
-
112
-
113
-
114
-
115
-
116
-
117
-
118
-
119
-
120
-
121
-
122
-
123
-
124
-
125
-
126
-
127
-
128
-
129
-
130
-
131
-
132
-
133
-
134
-
135
-
136
-
137
-
138
-
139
-
140
-
141
-
142
-
143
-
144
-
145
-
146
-
147
-
148
-
149
-
150
-
151
-
152
-
153
-
154
-
155
-
156
-
157
-
158
-
159
-
160
-
161
-
162
-
163
-
164
-
165
-
166
-
167
-
168
-
169
-
170
-
171
-
172
-
173
-
174
-
175
-
176
-
177
-
178
-
179
-
180
-
181
-
182
-
183
-
184
-
185
-
186
-
187
-
188
-
189
-
190
-
191
-
192
-
193
-
194
-
195
-
196
-
197
-
198
-
199
-
200
-
201
-
202
-
203
-
204
-
205
-
206
-
207
-
208
-
209
-
210
-
211
-
212
-
213
-
214
-
215
-
216
-
217
-
218
-
219
-
220
-
221
-
222
-
223
-
224
-
225
-
226
-
227
-
228
-
229
-
230
-
231
-
232
-
233
-
234
-
235
-
236
 |
 |

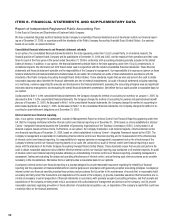
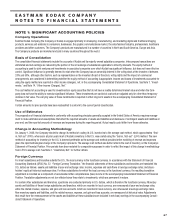
Foreign exchange gains and losses arising from transactions denominated in a currency other than the functional currency of the entity involved are
included in net (loss) earnings in the accompanying Consolidated Statement of Operations. The effects of foreign currency transactions, including
related hedging activities, were losses of $3 million, $31 million, and $10 million in the years 2006, 2005, and 2004, respectively, and are included
in other income (charges), net, in the accompanying Consolidated Statement of Operations. Refer to the “Derivative Financial Instruments” section of
Note 1, “Significant Accounting Policies,” for a description of how hedging activities are reflected in the Company’s Consolidated Statement of Operations.
Concentration of Credit Risk
Financial instruments that potentially subject the Company to significant concentrations of credit risk consist principally of cash and cash equivalents,
receivables, foreign currency forward contracts and commodity forward contracts. The Company places its cash and cash equivalents with high-qual-
ity financial institutions and limits the amount of credit exposure to any one institution. With respect to receivables, such receivables arise from sales
to numerous customers in a variety of industries, markets, and geographies around the world. Receivables arising from these sales are generally not
collateralized. The Company performs ongoing credit evaluations of its customers’ financial conditions and no single customer accounts for greater
than 10% of the sales of the Company. The Company maintains reserves for potential credit losses and such losses, in the aggregate, have not
exceeded management’s expectations. With respect to the foreign currency forward contracts and commodity forward contracts, the counterparties to
these contracts are major financial institutions. The Company has not experienced non-performance by any of its counterparties.
Cash Equivalents
All highly liquid investments with a remaining maturity of three months or less at date of purchase are considered to be cash equivalents.
Marketable Securities and Noncurrent Investments
The Company classifies its investment securities as either held-to-maturity, available-for-sale or trading. The Company’s debt and equity investment
securities are classified as held-to-maturity and available-for-sale, respectively. Held-to-maturity investments are carried at amortized cost and avail-
able-for-sale securities are carried at fair value, with the unrealized gains and losses reported in shareholders’ equity under the caption accumulated
other comprehensive (loss) income. The Company records losses that are other than temporary to net (loss) earnings.
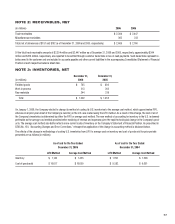
At December 31, 2006 and 2005, the Company had short-term investments classified as held-to-maturity of $18 million and $15 million, respectively.
These investments were included in other current assets in the accompanying Consolidated Statement of Financial Position. In addition, at December
31, 2006 and 2005, the Company had available-for-sale equity securities of $4 million and $13 million, respectively, included in other long-term assets
in the accompanying Consolidated Statement of Financial Position. The Company had no investment securities classified as trading securities as of
December 31, 2006 or 2005.
Inventories
Inventories are stated at the lower of cost or market. The cost of all of the Company’s inventories is determined by either the FIFO or average cost
method, which approximates current cost. The Company provides inventory reserves for excess, obsolete or slow-moving inventory based on changes
in customer demand, technology developments or other economic factors.
Properties
Properties are recorded at cost, net of accumulated depreciation. The Company principally calculates depreciation expense using the straight-line
method over the assets’ estimated useful lives, which are as follows:
Years
Buildings and building equipment 5-40
Land improvements 10-20
Leasehold improvements 3-10
Equipment 3-5
Tooling 1-3
Furniture and fixtures 3-15
Maintenance and repairs are charged to expense as incurred. Upon sale or other disposition, the applicable amounts of asset cost and accumulated
depreciation are removed from the accounts and the net amount, less proceeds from disposal, is charged or credited to net (loss) earnings.