Kodak 2006 Annual Report Download - page 54
Download and view the complete annual report
Please find page 54 of the 2006 Kodak annual report below. You can navigate through the pages in the report by either clicking on the pages listed below, or by using the keyword search tool below to find specific information within the annual report.-
 1
1 -
2
-
3
-
4
-
5
-
6
-
7
-
8
-
9
-
10
-
11
-
12
-
13
-
14
-
15
-
16
-
17
-
18
-
19
-
20
-
21
-
22
-
23
-
24
-
25
-
26
-
27
-
28
-
29
-
30
-
31
-
32
-
33
-
34
-
35
-
36
-
37
-
38
-
39
-
40
-
41
-
42
-
43
-
 44
44 -
 45
45 -
 46
46 -
 47
47 -
 48
48 -
 49
49 -
 50
50 -
 51
51 -
 52
52 -
 53
53 -
 54
54 -
 55
55 -
 56
56 -
 57
57 -
 58
58 -
 59
59 -
 60
60 -
 61
61 -
 62
62 -
 63
63 -
 64
64 -
65
-
66
-
67
-
68
-
69
-
70
-
71
-
72
-
73
-
74
-
75
-
76
-
77
-
78
-
79
-
80
-
81
-
82
-
83
-
84
-
85
-
86
-
87
-
88
-
89
-
90
-
91
-
92
-
93
-
94
-
95
-
96
-
97
-
98
-
99
-
100
-
101
-
102
-
103
-
104
-
105
-
106
-
107
-
108
-
109
-
110
-
111
-
112
-
113
-
114
-
115
-
116
-
117
-
118
-
119
-
120
-
121
-
122
-
123
-
124
-
125
-
126
-
127
-
128
-
129
-
130
-
131
-
132
-
133
-
134
-
135
-
136
-
137
-
138
-
139
-
140
-
141
-
142
-
143
-
144
-
145
-
146
-
147
-
148
-
149
-
150
-
151
-
152
-
153
-
154
-
155
-
156
-
157
-
158
-
159
-
160
-
161
-
162
-
163
-
164
-
165
-
166
-
167
-
168
-
169
-
170
-
171
-
172
-
173
-
174
-
175
-
176
-
177
-
178
-
179
-
180
-
181
-
182
-
183
-
184
-
185
-
186
-
187
-
188
-
189
-
190
-
191
-
192
-
193
-
194
-
195
-
196
-
197
-
198
-
199
-
200
-
201
-
202
-
203
-
204
-
205
-
206
-
207
-
208
-
209
-
210
-
211
-
212
-
213
-
214
-
215
-
216
-
217
-
218
-
219
-
220
-
221
-
222
-
223
-
224
-
225
-
226
-
227
-
228
-
229
-
230
-
231
-
232
-
233
-
234
-
235
-
236
 |
 |
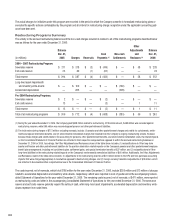
Pre-2004 Restructuring Programs
At December 31, 2006, the Company had remaining exit costs reserves of $11 million, relating to restructuring plans committed to or executed prior
to 2004. Most of these remaining exit costs reserves represent long-term lease payments, which will continue to be paid over periods throughout and
after 2007.
Liquidity and Capital Resources
2006
Cash Flow Activity
The Company’s cash and cash equivalents decreased $196 million from $1,665 million at December 31, 2005 to $1,469 million at December 31,
2006. The decrease resulted primarily from $947 million of net cash used in financing activities, $225 million of net cash used in investing activities,
partially offset by $956 million of net cash provided by operating activities.
The net cash provided by operating activities of $956 million was primarily attributable to the Company’s net loss of $601 million which, when ad-
justed for equity in earnings from unconsolidated affiliates, depreciation and amortization, the gain on sales of businesses/assets, restructuring costs,
asset impairments and other non-cash charges, and provision for deferred taxes, provided $702 million of operating cash. Additionally, decreases in
inventories of $271 million and decreases in receivables of $157 million, and increases in liabilities excluding borrowings of $61 million, contributed to
operating cash. The decrease in inventories is primarily due to planned inventory reductions driven by corporate initiatives, and a decline in demand for
traditional products. The decrease in receivables was primarily caused by the continued industry decline in sales of traditional products and services.
The increase in liabilities excluding borrowings is the result of non-cash adjustments to tax liabilities, partially offset by a decrease in accounts payable
and other liabilities. Included in net cash provided by operating activities was approximately $315 million provided by non-recurring licensing arrange-
ments and $548 million of cash used in restructuring activities during the period.
The net cash used in investing activities of $225 million was utilized primarily for capital expenditures of $379 million, partially offset by net proceeds
from the sale of assets of $178 million. The net cash used in financing activities of $947 million was the result of net payments of borrowings of $803
million and dividend payments of $144 million.
The Company’s primary uses of cash include restructuring payments, debt payments, capital additions, dividend payments, employee benefit plan
payments/contributions, and working capital needs.
Capital additions were $379 million in 2006, with the majority of the spending supporting new products, manufacturing productivity and quality
improvements, infrastructure improvements, equipment placements with customers, and ongoing environmental and safety initiatives.
During the year ended December 31, 2006, the Company expended $548 million against the related restructuring reserves and pension and other
postretirement liabilities, primarily for the payment of severance benefits. Certain employees whose positions were eliminated could elect to receive
severance payments for up to two years following their date of termination.
The Company has a dividend policy whereby it makes semi-annual payments of dividends, when declared, on the Company’s 10th business day each
July and December to shareholders of record on the close of the first business day of the preceding month. On May 10, 2006, the Board of Directors
declared a semi-annual cash dividend of $.25 per share payable to shareholders of record at the close of business on June 1, 2006. This dividend was
paid on July 18, 2006. On October 17, 2006, the Board of Directors declared a semi-annual cash dividend of $.25 per share payable to shareholders
of record at the close of business on November 1, 2006. This dividend was paid on December 14, 2006. The total dividends paid for the year ended
December 31, 2006 was $144 million.
The Company made contributions (funded plans) or paid benefits (unfunded plans) totaling approximately $187 million relating to its major U.S. and
non-U.S. defined benefit pension plans in the year ended December 31, 2006.
The Company paid benefits totaling approximately $224 million relating to its U.S., United Kingdom and Canada other postretirement benefit plans,
which represent the Company’s major other postretirement plans, in the year ended December 31, 2006.
The Company believes that its cash flow from operations in addition to asset sales will be sufficient to cover its working capital and capital investment
needs and the funds required for future debt reduction, restructuring payments, dividend payments, employee benefit plan payments/contributions,
and modest acquisitions. The Company’s cash balances and its financing arrangements, as described under “Sources of Liquidity” below, will be used
to bridge timing differences between expenditures and cash generated from operations.
Sources of Liquidity
Refer to Note 9, “Short-Term Borrowings and Long-Term Debt” of the Notes to Financial Statements for presentation of long-term debt, related maturi-
ties and interest rates as of December 31, 2006 and 2005.