Kodak 2006 Annual Report Download - page 37
Download and view the complete annual report
Please find page 37 of the 2006 Kodak annual report below. You can navigate through the pages in the report by either clicking on the pages listed below, or by using the keyword search tool below to find specific information within the annual report.-
 1
1 -
2
-
3
-
4
-
5
-
6
-
7
-
8
-
9
-
10
-
11
-
12
-
13
-
14
-
15
-
16
-
17
-
18
-
19
-
20
-
21
-
22
-
23
-
24
-
25
-
26
-
 27
27 -
 28
28 -
 29
29 -
 30
30 -
 31
31 -
 32
32 -
 33
33 -
 34
34 -
 35
35 -
 36
36 -
 37
37 -
 38
38 -
 39
39 -
 40
40 -
 41
41 -
 42
42 -
 43
43 -
 44
44 -
 45
45 -
 46
46 -
 47
47 -
48
-
49
-
50
-
51
-
52
-
53
-
54
-
55
-
56
-
57
-
58
-
59
-
60
-
61
-
62
-
63
-
64
-
65
-
66
-
67
-
68
-
69
-
70
-
71
-
72
-
73
-
74
-
75
-
76
-
77
-
78
-
79
-
80
-
81
-
82
-
83
-
84
-
85
-
86
-
87
-
88
-
89
-
90
-
91
-
92
-
93
-
94
-
95
-
96
-
97
-
98
-
99
-
100
-
101
-
102
-
103
-
104
-
105
-
106
-
107
-
108
-
109
-
110
-
111
-
112
-
113
-
114
-
115
-
116
-
117
-
118
-
119
-
120
-
121
-
122
-
123
-
124
-
125
-
126
-
127
-
128
-
129
-
130
-
131
-
132
-
133
-
134
-
135
-
136
-
137
-
138
-
139
-
140
-
141
-
142
-
143
-
144
-
145
-
146
-
147
-
148
-
149
-
150
-
151
-
152
-
153
-
154
-
155
-
156
-
157
-
158
-
159
-
160
-
161
-
162
-
163
-
164
-
165
-
166
-
167
-
168
-
169
-
170
-
171
-
172
-
173
-
174
-
175
-
176
-
177
-
178
-
179
-
180
-
181
-
182
-
183
-
184
-
185
-
186
-
187
-
188
-
189
-
190
-
191
-
192
-
193
-
194
-
195
-
196
-
197
-
198
-
199
-
200
-
201
-
202
-
203
-
204
-
205
-
206
-
207
-
208
-
209
-
210
-
211
-
212
-
213
-
214
-
215
-
216
-
217
-
218
-
219
-
220
-
221
-
222
-
223
-
224
-
225
-
226
-
227
-
228
-
229
-
230
-
231
-
232
-
233
-
234
-
235
-
236
 |
 |
0
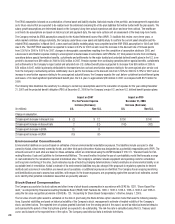
On October 3, 2006, the Company filed a claim for a federal tax refund of approximately $650 million related to a 1994 loss recognized on the sale of
shares of stock in a subsidiary that was disallowed at that time under Internal Revenue Service (IRS) regulations. Since that time, the IRS has issued
new regulations that serve as the basis for this refund claim. Due to the uncertainty of the claim, the Company, in accordance with its accounting poli-
cies, has not recorded a tax benefit related to this refund claim.
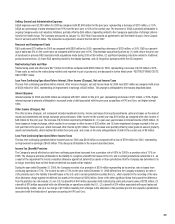
Valuation Allowance – Outside the U.S.
During the fourth quarter of 2006, based on the Company’s assessment of positive and negative evidence regarding the realization of the net deferred
tax assets, the Company recorded additional valuation allowances of $90 million against its net deferred tax assets in certain jurisdictions outside the
U.S. In accordance with SFAS No. 109, the Company’s assessment included the evaluation of scheduled reversals of deferred tax assets and liabilities,
estimates of projected future taxable income, carryback potential and tax planning strategies. Based on the Company’s assessment of realizability, the
Company concluded that it was no longer more likely than not that these net deferred tax assets would be realized and, as such, recorded a valuation
allowance of $90 million.
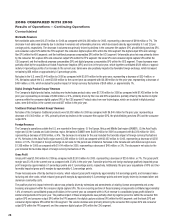
Loss From Continuing Operations
The loss from continuing operations for 2006 was $600 million, or $2.09 per basic and diluted share, as compared with a loss from continuing
operations for 2005 of $1,354 million, or $4.70 per basic and diluted share, representing an improvement in earnings of $754 million. This change is
attributable to the reasons described above.
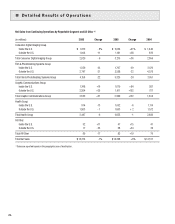
Consumer Digital Imaging Group
Worldwide Revenues
Net worldwide sales for the Consumer Digital Imaging Group (CDG) segment were $2,920 million for 2006 as compared with $3,215 million for 2005,
representing a decrease of $295 million, or 9%. The decrease in net sales was comprised of: (1) declines in volumes, which reduced net sales by
approximately 5.8 percentage points, driven primarily by the consumer digital capture SPG, and (2) unfavorable price/mix, which decreased sales by
approximately 3.8 percentage points, driven primarily by declines in the kiosk SPG and consumer digital capture SPG. The negative price/mix impact
includes the positive effects to the consumer digital capture SPG of extensions and amendments of existing license arrangements and a new licensing
arrangement, portions of which were non-recurring. These arrangements provide the Company with a return on portions of historical R&D investments
and similar opportunities are expected to have a continuing impact on the results of operations. These declines were partially offset by positive foreign
exchange, which increased net sales by approximately 0.4 percentage points.
CDG segment net sales in the U.S. were $1,872 million for the current year as compared with $2,034 million for the prior year, representing a
decrease of $162 million, or 8%. CDG segment net sales outside the U.S. were $1,048 million for the current year as compared with $1,181 million for
the prior year, representing a decrease of $133 million, or 11%.
Net worldwide sales of consumer digital capture products, which include consumer digital cameras, accessories, memory products, imaging sensors,
and intellectual property royalties, decreased 17% in 2006 as compared with the prior year, primarily reflecting volume decreases, as well as negative
price/mix. The negative price/mix impact includes the positive impacts of extensions and amendments of existing license arrangements and a new
licensing arrangement, as mentioned above. These arrangements provide the Company with a return on portions of historical R&D investments and
similar opportunities are expected to have a continuing impact on the results of operations. According to the NPD Group’s consumer tracking service,
Kodak EasyShare digital cameras were number one in unit market share in the U.S. for the year 2006. On a year-to-date basis through November, the
Company remains in the top three unit market share position on a worldwide basis for consumer digital cameras.
Net worldwide sales of picture maker kiosks/media (the kiosk SPG) increased 11% in 2006 as compared with 2005, as a result of significant volume
increases, partially offset by negative price/mix. Sales continue to be driven by strong consumable sales at retail locations with 4x6 media volumes
increasing 53% versus last year.
Net worldwide sales of the home printing solutions SPG, which includes inkjet photo paper and printer docks/media, decreased 2% in the current year
as compared with the prior year, driven by negative price/mix, partially offset by volume increases. On a year-to-date basis through November, the
Company’s printer dock product held a leading market share position in the U.S., U.K., and Australia.
Gross Profit
Gross profit for the CDG segment was $675 million for 2006 as compared with $598 million for the prior year, representing an increase of $77 million
or 13%. The gross profit margin was 23.1% in the current year as compared with 18.6% in the prior year. The 4.5 percentage point increase was pri-
marily attributable to improvements in price/mix, which impacted gross profit margins by approximately 4.8 percentage points, primarily due to exten-
sions and amendments to existing license arrangements during the current year, and a new licensing arrangement, as mentioned above. The impact
of the non-recurring portions of these licensing arrangements contributed approximately 6.5% of revenue to segment gross profit dollars in 2006, as
compared with 1.8% of revenue to segment gross profit dollars for similar arrangements in 2005. Additionally, foreign exchange positively impacted
gross profit margins by approximately 0.2 percentage points. These increases were partially offset by increased manufacturing costs, which reduced
gross profit margins by approximately 0.3 percentage points, and volume declines, which negatively impacted gross profit margins by approximately
0.2 percentage points.