Kodak 2006 Annual Report Download - page 38
Download and view the complete annual report
Please find page 38 of the 2006 Kodak annual report below. You can navigate through the pages in the report by either clicking on the pages listed below, or by using the keyword search tool below to find specific information within the annual report.-
 1
1 -
2
-
3
-
4
-
5
-
6
-
7
-
8
-
9
-
10
-
11
-
12
-
13
-
14
-
15
-
16
-
17
-
18
-
19
-
20
-
21
-
22
-
23
-
24
-
25
-
26
-
27
-
 28
28 -
 29
29 -
 30
30 -
 31
31 -
 32
32 -
 33
33 -
 34
34 -
 35
35 -
 36
36 -
 37
37 -
 38
38 -
 39
39 -
 40
40 -
 41
41 -
 42
42 -
 43
43 -
 44
44 -
 45
45 -
 46
46 -
 47
47 -
 48
48 -
49
-
50
-
51
-
52
-
53
-
54
-
55
-
56
-
57
-
58
-
59
-
60
-
61
-
62
-
63
-
64
-
65
-
66
-
67
-
68
-
69
-
70
-
71
-
72
-
73
-
74
-
75
-
76
-
77
-
78
-
79
-
80
-
81
-
82
-
83
-
84
-
85
-
86
-
87
-
88
-
89
-
90
-
91
-
92
-
93
-
94
-
95
-
96
-
97
-
98
-
99
-
100
-
101
-
102
-
103
-
104
-
105
-
106
-
107
-
108
-
109
-
110
-
111
-
112
-
113
-
114
-
115
-
116
-
117
-
118
-
119
-
120
-
121
-
122
-
123
-
124
-
125
-
126
-
127
-
128
-
129
-
130
-
131
-
132
-
133
-
134
-
135
-
136
-
137
-
138
-
139
-
140
-
141
-
142
-
143
-
144
-
145
-
146
-
147
-
148
-
149
-
150
-
151
-
152
-
153
-
154
-
155
-
156
-
157
-
158
-
159
-
160
-
161
-
162
-
163
-
164
-
165
-
166
-
167
-
168
-
169
-
170
-
171
-
172
-
173
-
174
-
175
-
176
-
177
-
178
-
179
-
180
-
181
-
182
-
183
-
184
-
185
-
186
-
187
-
188
-
189
-
190
-
191
-
192
-
193
-
194
-
195
-
196
-
197
-
198
-
199
-
200
-
201
-
202
-
203
-
204
-
205
-
206
-
207
-
208
-
209
-
210
-
211
-
212
-
213
-
214
-
215
-
216
-
217
-
218
-
219
-
220
-
221
-
222
-
223
-
224
-
225
-
226
-
227
-
228
-
229
-
230
-
231
-
232
-
233
-
234
-
235
-
236
 |
 |
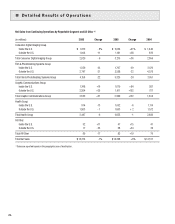
Selling, General and Administrative Expenses
SG&A expenses for the CDG segment decreased $48 million, or 9%, from $551 million in 2005 to $503 million in the current year, and remained
constant as a percentage of sales at 17%. This decrease was primarily driven by a decline in advertising spending as a result of focused cost reduc-
tion activities.
Research and Development Costs
R&D costs for the CDG segment decreased $8 million, or 4%, from $179 million in 2005 to $171 million in the current year and remained constant as
a percentage of sales at 6%.
Earnings (Loss) From Continuing Operations Before Interest, Other Income (Charges), Net and Income Taxes
Earnings from continuing operations before interest, other income (charges), net and income taxes for the CDG segment were $1 million in 2006 com-
pared with a loss of $131 million in 2005, representing an increase in earnings of $132 million or 101%, as a result of the factors described above.
Film and Photofinishing Systems Group
Worldwide Revenues
Net worldwide sales for the Film and Photofinishing Systems Group (FPG) segment were $4,156 million for 2006 as compared with $5,325 million
for 2005, representing a decrease of $1,169 million, or 22%. The decrease in net sales was comprised of: (1) lower volumes, which decreased 2006
sales by approximately 20.5 percentage points, driven primarily by declines in the consumer film capture SPG, the consumer output SPG, and the
photofinishing services SPG; and (2) declines related to negative price/mix, which reduced net sales by approximately 1.9 percentage points, primarily
driven by the consumer film capture SPG and the consumer output SPG. These declines were partially offset by favorable foreign exchange, which
increased net sales by approximately 0.4 percentage points.
FPG segment net sales in the U.S. were $1,359 million for the current year as compared with $1,767 million for 2005, representing a decrease of
$408 million, or 23%. FPG segment net sales outside the U.S. were $2,797 million for 2006 as compared with $3,558 million for the prior year, repre-
senting a decrease of $761 million, or 21%.
Net worldwide sales of the consumer film capture SPG, including consumer roll film (35mm and APS film), one-time-use cameras (OTUC), profes-
sional films, reloadable traditional film cameras and batteries/videotape, decreased 29% in 2006 as compared with 2005, primarily reflecting industry
volume declines.
Net worldwide sales for the consumer and professional output SPGs, which include color negative paper and photochemicals, decreased 20% in 2006
as compared with 2005, primarily reflecting industry volume declines and negative price/mix.
Net worldwide sales for the photofinishing services SPG, which includes equipment and photofinishing services at retail on-site and Qualex in the U.S.
and CIS (Consumer Imaging Services) outside the U.S., decreased 45% in 2006 as compared with 2005, reflecting continuing volume declines in the
development and processing of consumer films.
Net worldwide sales for the entertainment imaging SPGs, including origination, intermediate, and print films for the entertainment industry decreased
2%, primarily reflecting origination film volume declines and negative price/mix for print film, partially offset by volume increases for intermediate film.
These results also reflect more conservative motion picture release strategies by major studios including the maturation of industry practice regarding
simultaneous worldwide releases of major feature films.
Gross Profit
Gross profit for the FPG segment was $1,068 million for 2006 as compared with $1,630 million for the prior year, representing a decrease of $562
million or 34%. The gross profit margin was 25.7% in the current year as compared with 30.6% in 2005. The 4.9 percentage point decrease was
primarily attributable to increased manufacturing costs, which reduced gross profit margins by approximately 4.3 percentage points. These increased
costs were driven by increased depreciation expense principally due to asset useful life changes in the third quarter of 2005 and higher silver costs.
Volume declines negatively impacted gross profit margins by approximately 0.7 percentage points, partially offset by the favorable impact of foreign
exchange, which increased gross profit margins by approximately 0.2 percentage points. The impact of price/mix on gross profit margins was not
significant.
Selling, General and Administrative Expenses
SG&A expenses for the FPG segment decreased $331 million, or 33%, from $1,001 million in 2005 to $670 million in the current year, and decreased
as a percentage of sales from 19% in the prior year to 16% in the current year. The decline in SG&A was attributable to ongoing Company-wide cost
reduction initiatives.