Kodak 2006 Annual Report Download - page 36
Download and view the complete annual report
Please find page 36 of the 2006 Kodak annual report below. You can navigate through the pages in the report by either clicking on the pages listed below, or by using the keyword search tool below to find specific information within the annual report.-
 1
1 -
2
-
3
-
4
-
5
-
6
-
7
-
8
-
9
-
10
-
11
-
12
-
13
-
14
-
15
-
16
-
17
-
18
-
19
-
20
-
21
-
22
-
23
-
24
-
25
-
 26
26 -
 27
27 -
 28
28 -
 29
29 -
 30
30 -
 31
31 -
 32
32 -
 33
33 -
 34
34 -
 35
35 -
 36
36 -
 37
37 -
 38
38 -
 39
39 -
 40
40 -
 41
41 -
 42
42 -
 43
43 -
 44
44 -
 45
45 -
 46
46 -
47
-
48
-
49
-
50
-
51
-
52
-
53
-
54
-
55
-
56
-
57
-
58
-
59
-
60
-
61
-
62
-
63
-
64
-
65
-
66
-
67
-
68
-
69
-
70
-
71
-
72
-
73
-
74
-
75
-
76
-
77
-
78
-
79
-
80
-
81
-
82
-
83
-
84
-
85
-
86
-
87
-
88
-
89
-
90
-
91
-
92
-
93
-
94
-
95
-
96
-
97
-
98
-
99
-
100
-
101
-
102
-
103
-
104
-
105
-
106
-
107
-
108
-
109
-
110
-
111
-
112
-
113
-
114
-
115
-
116
-
117
-
118
-
119
-
120
-
121
-
122
-
123
-
124
-
125
-
126
-
127
-
128
-
129
-
130
-
131
-
132
-
133
-
134
-
135
-
136
-
137
-
138
-
139
-
140
-
141
-
142
-
143
-
144
-
145
-
146
-
147
-
148
-
149
-
150
-
151
-
152
-
153
-
154
-
155
-
156
-
157
-
158
-
159
-
160
-
161
-
162
-
163
-
164
-
165
-
166
-
167
-
168
-
169
-
170
-
171
-
172
-
173
-
174
-
175
-
176
-
177
-
178
-
179
-
180
-
181
-
182
-
183
-
184
-
185
-
186
-
187
-
188
-
189
-
190
-
191
-
192
-
193
-
194
-
195
-
196
-
197
-
198
-
199
-
200
-
201
-
202
-
203
-
204
-
205
-
206
-
207
-
208
-
209
-
210
-
211
-
212
-
213
-
214
-
215
-
216
-
217
-
218
-
219
-
220
-
221
-
222
-
223
-
224
-
225
-
226
-
227
-
228
-
229
-
230
-
231
-
232
-
233
-
234
-
235
-
236
 |
 |
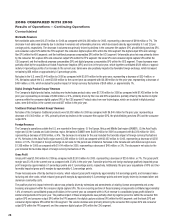
Selling, General and Administrative Expenses
SG&A expenses were $2,389 million for 2006 as compared with $2,668 million for the prior year, representing a decrease of $279 million, or 10%.
SG&A as a percentage of sales decreased from 19% from the prior year to 18% in the current year. The decrease in SG&A is primarily attributable to
ongoing Company-wide cost reduction initiatives, partially offset by $45 million of spending related to the Company’s exploration of strategic alterna-
tives for the Health Group. The Company announced on January 10, 2007 that it has reached an agreement to sell the Health Group to Onex Corpora-
tion for as much as $2.55 billion. The transaction is expected to close in the first half of 2007.
Research and Development Costs
R&D costs were $710 million for 2006 as compared with $892 million for 2005, representing a decrease of $182 million, or 20%. R&D as a percent-
age of sales was 5% for the current year as compared with the prior year of 6%. This decrease was primarily driven by: (1) write-offs in the prior year
of purchased in-process R&D associated with acquisitions made during 2005 of $54 million, (2) significant spending reductions related to traditional
products and services, (3) lower R&D spending related to the display business, and (4) integration synergies within the GCG segment.
Restructuring Costs and Other
Restructuring costs and other were $471 million for 2006 as compared with $690 million for 2005, representing a decrease of $219 million or 32%.
These costs, as well as the restructuring-related costs reported in cost of goods sold, are discussed in further detail under “RESTRUCTURING COSTS
AND OTHER” below.
Loss From Continuing Operations Before Interest, Other Income (Charges), Net and Income Taxes
The loss from continuing operations before interest, other income (charges), net and income taxes for 2006 was $202 million as compared with a loss
of $632 million for 2005, representing an improvement in earnings of $430 million. This change is attributable to the reasons described above.
Interest Expense
Interest expense for 2006 was $262 million as compared with $211 million for the prior year, representing an increase of $51 million, or 24%. Higher
interest expense is primarily attributable to increased levels of debt associated with the prior year acquisitions of KPG and Creo, and higher interest
rates.
Other Income (Charges), Net
The other income (charges), net component includes investment income, income and losses from equity investments, gains and losses on the sales of
assets and investments and foreign exchange gains and losses. Other income for the current year was $118 million as compared with other income of
$44 million for the prior year. The increase of $74 million is primarily attributable to: (1) a year-over-year increase in interest income of $35 million, (2)
lower losses on foreign exchange, which resulted in an increase in other income of $28 million, and (3) lower impairment charges recorded in the cur-
rent year than in the prior year, which increased other income by $33 million. These increases were partially offset by lower gains on sales of property,
assets and investments, which declined $9 million from prior year, and a loss on the early extinguishment of debt in the current year of $9 million.
Loss From Continuing Operations Before Income Taxes
The loss from continuing operations before income taxes for 2006 was $346 million as compared with a loss of $799 million for 2005, representing
an improvement in earnings of $453 million. This change is attributable to the reasons described above.
Income Tax (Benefit) Provision
The Company’s annual effective tax rate from continuing operations increased from a provision rate of 69% for 2005 to a provision rate of 73% for
2006. The change is primarily attributable to the inability to recognize a benefit from losses in the U.S. and in certain jurisdictions outside the U.S., as
a result of the requirement to record a valuation allowance against net deferred tax assets in those jurisdictions that the Company has determined it is
no longer more likely than not that these net deferred tax assets will be realized.
During the year ended December 31, 2006, the Company recorded a tax provision of $254 million representing an income tax rate on losses from
continuing operations of 73%. The income tax rate of 73% for the year ended December 31, 2006 differs from the Company’s statutory tax rate of
35% primarily due to the inability to benefit losses in the U.S. and in certain jurisdictions outside the U.S., which resulted in the recording of the valu-
ation allowance charge against net deferred tax assets in the amount of $393 million. Some of the other significant items that caused the difference
from the statutory tax rate include: (1) non-U.S. tax benefits of $40 million associated with restructuring costs and property sales of $728 million; (2)
a benefit of $16 million associated with rate differentials on operations outside the U.S.; (3) a benefit of $14 million associated with export sales and
manufacturing credits; and (4) a tax charge of $13 million resulting from changes to the allocation of the purchase price to the respective jurisdictions
associated with the finalization of purchase accounting for KPG and Creo.