IBM 2014 Annual Report Download - page 91
Download and view the complete annual report
Please find page 91 of the 2014 IBM annual report below. You can navigate through the pages in the report by either clicking on the pages listed below, or by using the keyword search tool below to find specific information within the annual report.-
 1
1 -
2
-
3
-
4
-
5
-
6
-
7
-
8
-
9
-
10
-
11
-
12
-
13
-
14
-
15
-
16
-
17
-
18
-
19
-
20
-
21
-
22
-
23
-
24
-
25
-
26
-
27
-
28
-
29
-
30
-
31
-
32
-
33
-
34
-
35
-
36
-
37
-
38
-
39
-
40
-
41
-
42
-
43
-
44
-
45
-
46
-
47
-
48
-
49
-
50
-
51
-
52
-
53
-
54
-
55
-
56
-
57
-
58
-
59
-
60
-
61
-
62
-
63
-
64
-
65
-
66
-
67
-
68
-
69
-
70
-
71
-
72
-
73
-
74
-
75
-
76
-
77
-
78
-
79
-
80
-
 81
81 -
 82
82 -
 83
83 -
 84
84 -
 85
85 -
 86
86 -
 87
87 -
 88
88 -
 89
89 -
 90
90 -
 91
91 -
 92
92 -
 93
93 -
 94
94 -
 95
95 -
 96
96 -
 97
97 -
 98
98 -
 99
99 -
 100
100 -
 101
101 -
102
-
103
-
104
-
105
-
106
-
107
-
108
-
109
-
110
-
111
-
112
-
113
-
114
-
115
-
116
-
117
-
118
-
119
-
120
-
121
-
122
-
123
-
124
-
125
-
126
-
127
-
128
-
129
-
130
-
131
-
132
-
133
-
134
-
135
-
136
-
137
-
138
-
139
-
140
-
141
-
142
-
143
-
144
-
145
-
146
-
147
-
148
-
149
-
150
-
151
-
152
-
153
-
154
-
155
-
156
-
157
-
158
 |
 |

Notes to Consolidated Financial Statements
International Business Machines Corporation and Subsidiary Companies
90
Product Warranties
The company offers warranties for its hardware products that
generally range up to three years, with the majority being either
one or three years. Estimated costs for warranty terms standard
to the deliverable are recognized when revenue is recorded for
the related deliverable. The company estimates its warranty costs
standard to the deliverable based on historical warranty claim
experience and estimates of future spending, and applies this esti-
mate to the revenue stream for products under warranty. Estimated
future costs for warranties applicable to revenue recognized in the
current period are charged to cost of sales. The warranty liability is
reviewed quarterly to verify that it properly reflects the remaining
obligation based on the anticipated expenditures over the bal-
ance of the obligation period. Adjustments are made when actual
warranty claim experience differs from estimates. Costs from
fixed-price support or maintenance contracts, including extended
warranty contracts, are recognized as incurred.
Revenue from separately priced extended warranty contracts
is initially recorded as deferred income and subsequently recog-
nized on a straight-line basis over the delivery period. Changes
in deferred income for extended warranty contracts, and in the
warranty liability for standard warranties, which are included in
other accrued expenses and liabilities and other liabilities in the
Consolidated Statement of Financial Position, are presented in the
following tables:
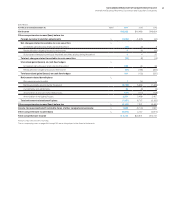
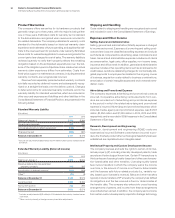
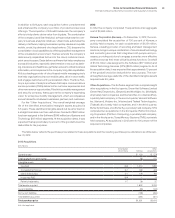
Standard Warranty Liability
($ in millions)
2014 2013
Balance at January 1 $ 376 $ 394
Current period accruals 240 346
Accrual adjustments to reflect experience* (120) 22
Charges incurred (298) (387)
Balance at December 31 $ 197 $ 376
* Includes an adjustment of ($125 million) in 2014 related to the industry standard server
divestiture.
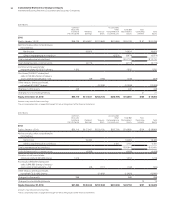
Extended Warranty Liability (Deferred Income)
($ in millions)
2014 2013
Balance at January 1 $ 579 $ 606
Revenue deferred for new extended
warranty contracts 298 305
Amortization of deferred revenue* (316) (324)
Other** (24) (8)
Balance at December 31 $ 536 $ 579
Current portion $ 254 $ 284
Noncurrent portion 282 295
Balance at December 31 $ 536 $ 579
* Includes an adjustment of $(21 million) in 2014 related to the industry standard server
divestiture.
** Other consists primarily of foreign currency translation adjustments.
Shipping and Handling
Costs related to shipping and handling are recognized as incurred
and included in cost in the Consolidated Statement of Earnings.
Expense and Other Income
Selling, General and Administrative
Selling, general and administrative (SG&A) expense is charged
to income as incurred. Expenses of promoting and selling prod-
ucts and services are classified as selling expense and include
such items as compensation, advertising, sales commissions and
travel. General and administrative expense includes such items
as compensation, legal costs, office supplies, non-income taxes,
insurance and office rental. In addition, general and administrative
expense includes other operating items such as an allowance for
credit losses, workforce rebalancing charges for contractually obli-
gated payments to employees terminated in the ongoing course
of business, acquisition costs related to business combinations,
amortization of certain intangible assets and environmental reme-
diation costs.
Advertising and Promotional Expense
The company expenses advertising and promotional costs as
incurred. Cooperative advertising reimbursements from ven-
dors are recorded net of advertising and promotional expense
in the period in which the related advertising and promotional
expense is incurred. Advertising and promotional expense, which
includes media, agency and promotional expense, was $1,307
million, $1,294 million and $1,339 million in 2014, 2013 and 2012,
respectively, and is recorded in SG&A expense in the Consolidated
Statement of Earnings.
Research, Development and Engineering
Research, development and engineering (RD&E) costs are
expensed as incurred. Software costs that are incurred to pro-
duce the finished product after technological feasibility has been
established are capitalized as an intangible asset.
Intellectual Property and Custom Development Income
The company licenses and sells the rights to certain of its intel-
lectual property (IP) including internally developed patents, trade
secrets and technological know-how. Certain IP transactions to
third parties are licensing/royalty-based and others are transac-
tion-based sales and other transfers. Licensing/royalty-based
fees involve transfers in which the company earns the income
over time, or the amount of income is not fixed or determinable
until the licensee sells future related products (i.e., variable roy-
alty, based upon licensee’s revenue). Sales and other transfers
typically include transfers of IP whereby the company has fulfilled
its obligations and the fee received is fixed or determinable at
the transfer date. The company also enters into cross-licensing
arrangements of patents, and income from these arrangements
is recorded when earned. In addition, the company earns income
from certain custom development projects for strategic technology