IBM 2014 Annual Report Download - page 25
Download and view the complete annual report
Please find page 25 of the 2014 IBM annual report below. You can navigate through the pages in the report by either clicking on the pages listed below, or by using the keyword search tool below to find specific information within the annual report.-
 1
1 -
2
-
3
-
4
-
5
-
6
-
7
-
8
-
9
-
10
-
11
-
12
-
13
-
14
-
 15
15 -
 16
16 -
 17
17 -
 18
18 -
 19
19 -
 20
20 -
 21
21 -
 22
22 -
 23
23 -
 24
24 -
 25
25 -
 26
26 -
 27
27 -
 28
28 -
 29
29 -
 30
30 -
 31
31 -
 32
32 -
 33
33 -
 34
34 -
 35
35 -
36
-
37
-
38
-
39
-
40
-
41
-
42
-
43
-
44
-
45
-
46
-
47
-
48
-
49
-
50
-
51
-
52
-
53
-
54
-
55
-
56
-
57
-
58
-
59
-
60
-
61
-
62
-
63
-
64
-
65
-
66
-
67
-
68
-
69
-
70
-
71
-
72
-
73
-
74
-
75
-
76
-
77
-
78
-
79
-
80
-
81
-
82
-
83
-
84
-
85
-
86
-
87
-
88
-
89
-
90
-
91
-
92
-
93
-
94
-
95
-
96
-
97
-
98
-
99
-
100
-
101
-
102
-
103
-
104
-
105
-
106
-
107
-
108
-
109
-
110
-
111
-
112
-
113
-
114
-
115
-
116
-
117
-
118
-
119
-
120
-
121
-
122
-
123
-
124
-
125
-
126
-
127
-
128
-
129
-
130
-
131
-
132
-
133
-
134
-
135
-
136
-
137
-
138
-
139
-
140
-
141
-
142
-
143
-
144
-
145
-
146
-
147
-
148
-
149
-
150
-
151
-
152
-
153
-
154
-
155
-
156
-
157
-
158
 |
 |
24 Management Discussion
International Business Machines Corporation and Subsidiary Companies
combined increased 16percent with double-digit growth in each
quarter. In total, the strategic imperatives generated $25 billion
in revenue, which represented approximately 27percent of total
revenue. Business analytics revenue of $17 billion increased 7per-
cent year to year with growth led by the consulting business as
the company helps clients extract value from their data. Cloud
revenue of $7 billion was up 60percent year to year as client
demand grows for higher-value cloud solutions across public,
private and hybrid clouds. Cloud delivered as a service revenue
increased approximately 75percent to $3 billion in 2014, and exited
the year with an annual run rate of $3.5 billion. Cloud revenue also
includes the company’s foundational offerings where it provides
software, hardware and services to clients to build private clouds.
In engagement, the mobile business more than tripled year to year
with strong growth in MobileFirst driven by the integrated portfo-
lio of offerings. In addition, Social was up 3percent and Security
increased 19percent year to year.
The company is continuing to shift its investments and
resources to the strategic imperatives and solutions that address
clients’ most critical needs. During 2014, the company spent
approximately 6percent of revenue in research and development
and invested approximately $4 billion on capital investments—
supporting actions in a number of areas that will yield financial
benefits in the future. For example:
• Launched Bluemix, the company’s cloud platform-as-a-
service for the enterprise.
• Investing to globally expand the SoftLayer cloud datacenters.
• Investing to bring Watson’s capabilities to the enterprise and
building a partner ecosystem, effectively creating a market
for cognitive computing.
• Introduced cloud application innovations around Watson
Analytics and Verse.
• Launched POWER8, and building the OpenPOWER consortium.
• Formed a partnership with Apple for enterprise mobility, with
Twitter for big data, and with SAP and Tencent for cloud.
The recurring core franchises include the annuity businesses, and
the highly recurring portions of the transactions business, such as
mainframe revenue from the largest clients. This content has annu-
ity characteristics, and in many cases, it supports mission critical
processes for clients. The model for these combined businesses
is to have stable revenue, with improving margins. In 2014, rev-
enue was down approximately 3percent with a modest decline in
margin. The decline was primarily driven by the mainframe product
cycle and currency.
The company’s high-value transactional businesses include
project-based work in services, transactional software, Power Sys
-
tems and Storage—in areas other than the strategic imperatives.
The objective for these businesses is to optimize the business
model and maintain margins. In 2014, revenue declined year to year,
with gross margins over 40percent. Performance reflected the
secular challenges faced in some parts of the hardware business
as the company works through the transitions resulting from the
actions taken to reposition the hardware business for high value.
In 2014, the company divested businesses that no longer fit its
strategic profile—industry standard servers, customer care busi-
ness process outsourcing services and the announced divestiture
of the Microelectronics business. These three businesses gener-
ated approximately $7 billion of revenue when reported in 2013, but
had a pre-tax loss of approximately $500million. The divestitures
reduce revenue but improve the company’s profit profile, consis-
tent with the shift to higher value.
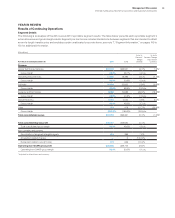
From a segment perspective, Global Services revenue declined
3.5percent as reported, but increased 1percent adjusted for the
divestitures (2points) and currency (2points). Global Technology
Services (GTS) declined 3.7percent as reported, but increased
2percent adjusted for the divestitures (3points) and currency
(3points) with growth in Outsourcing and Integrated Technology
Services. Global Business Services revenue decreased 3.1percent
(1percent adjusted for currency) with Application Outsourcing rev-
enue down 8percent (6percent adjusted for currency). Software
revenue declined 1.9percent (1percent adjusted for currency).
Total middleware revenue was flat as reported, but increased
1percent at constant currency. Systems and Technology revenue
decreased 23.0percent as reported and 17percent adjusted for
the divested industry standard server business (5points) and cur-
rency (1 point). Performance reflected the impact of the Systemz
product cycle as well as declines in Power Systems and Stor-
age. In 2014, the company took significant actions to reposition
the Systems and Technology business for higher value, and rein-
forced its commitment to driving innovation in high-end systems
and storage.
From a geographic perspective, revenue in the major markets
declined 4.3percent as reported and 1percent adjusted for the
divestitures (2points) and currency (1 point). Growth markets reve-
nue decreased 9.9percent as reported and 3percent adjusted for
the divestitures (3points) and currency (4points) compared to the
prior year. Within the growth markets, the BRIC countries (Brazil,
Russia, India and China) decreased 10.7percent as reported
and 5percent adjusted for divestitures (3points) and currency
(3points).
The consolidated gross profit margin of 50.0percent improved
0.5points year to year. The operating (non-GAAP) gross margin
of 50.6percent increased 0.1points compared to the prior year
primarily driven by an improved mix toward Software.
Total expense and other (income) decreased 7.1percent in 2014
versus the prior year. Total operating (non-GAAP) expense and
other (income) decreased 6.3percent compared to the prior year.