IBM 2014 Annual Report Download - page 51
Download and view the complete annual report
Please find page 51 of the 2014 IBM annual report below. You can navigate through the pages in the report by either clicking on the pages listed below, or by using the keyword search tool below to find specific information within the annual report.-
 1
1 -
2
-
3
-
4
-
5
-
6
-
7
-
8
-
9
-
10
-
11
-
12
-
13
-
14
-
15
-
16
-
17
-
18
-
19
-
20
-
21
-
22
-
23
-
24
-
25
-
26
-
27
-
28
-
29
-
30
-
31
-
32
-
33
-
34
-
35
-
36
-
37
-
38
-
39
-
40
-
 41
41 -
 42
42 -
 43
43 -
 44
44 -
 45
45 -
 46
46 -
 47
47 -
 48
48 -
 49
49 -
 50
50 -
 51
51 -
 52
52 -
 53
53 -
 54
54 -
 55
55 -
 56
56 -
 57
57 -
 58
58 -
 59
59 -
 60
60 -
 61
61 -
62
-
63
-
64
-
65
-
66
-
67
-
68
-
69
-
70
-
71
-
72
-
73
-
74
-
75
-
76
-
77
-
78
-
79
-
80
-
81
-
82
-
83
-
84
-
85
-
86
-
87
-
88
-
89
-
90
-
91
-
92
-
93
-
94
-
95
-
96
-
97
-
98
-
99
-
100
-
101
-
102
-
103
-
104
-
105
-
106
-
107
-
108
-
109
-
110
-
111
-
112
-
113
-
114
-
115
-
116
-
117
-
118
-
119
-
120
-
121
-
122
-
123
-
124
-
125
-
126
-
127
-
128
-
129
-
130
-
131
-
132
-
133
-
134
-
135
-
136
-
137
-
138
-
139
-
140
-
141
-
142
-
143
-
144
-
145
-
146
-
147
-
148
-
149
-
150
-
151
-
152
-
153
-
154
-
155
-
156
-
157
-
158
 |
 |
50 Management Discussion
International Business Machines Corporation and Subsidiary Companies
Systems and Technology
Systems and Technology revenue of $2,406 million decreased
39.0percent as reported and 12percent adjusted for the dives-
titure of the industry standard server business (24points) and
currency (3points) in the fourth quarter of 2014, versus the same
period in 2013.
Systemz revenue decreased 25.8percent (23percent adjusted
for currency), compared to the prior year period. This performance
reflected the fact that the product was in the tenth and final quar-
ter of this product cycle. The last 10-quarter cycle was the z10.
Comparing the current cycle to that of the z10, program-to-date
Systemz revenue and gross profit is right on top of that cycle. The
company continues to innovate on the platform, and in January
2015 announced the z13, the new generation of the IBM mainframe.
Power Systems revenue decreased 13.4percent (11percent
adjusted for currency) compared to the prior year period which
represented a modest sequential improvement at constant cur-
rency. Power has been repositioned and is not only a systems
business, but also an open chip processor and an IP income
opportunity through the OpenPOWER foundation. There was
double-digit growth in the low end, driven by entry-level POWER8-
based systems, and in the fourth quarter, the company introduced
its high-end POWER8 enterprise systems. In addition, the com-
pany saw continued expansion of the OpenPOWER consortium,
now with over 80 members.
Storage revenue decreased 8.3percent (5percent adjusted
for currency) in the fourth quarter compared to the prior year
period representing a modest sequential improvement compared
to the rate in the prior quarter. There was strong growth again in the
FlashSystems and Storwize portfolio. This growth was offset by
the wind down of the legacy OEM business and continued weak-
ness in high-end disk.
Systems and Technology’s gross profit margin of 49.6percent
increased 7.3points in the fourth quarter of 2014 versus the prior
year. The increase was primarily due to mix (7.6points) driven
by the divestiture of the industry standard server business. This
improvement was offset by a decrease due to margin. Lower mar-
gins in Power Systems (0.8points) and Storage (0.6points) were
partially offset by higher margins in Systemz (0.6points).
Systems and Technology’s pre-tax income of $388 million
increased 12.2percent with a pre-tax margin of 15.5percent, up
7points year to year. This performance included a workforce rebal-
ancing charge of $32 million in the fourth quarter of 2014 which
impacted year-to-year growth by approximately 9points and pre-
tax margin in the fourth quarter by approximately 1point.
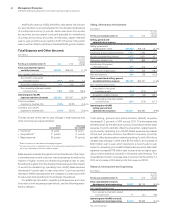
Global Financing
Global Financing revenue of $532 million was down 0.5percent
due to a decrease in used equipment sales revenue, partially offset
by an increase in financing revenue. The Global Financing fourth-
quarter pre-tax income decreased 10.8percent to $526 million
and the pre-tax margin decreased 2.7points to 47.0percent. The
decrease in pre-tax income was driven by a decrease in gross
profit ($46 million) as well as an increase in financing receivable
provisions ($26 million), partially offset by a reduction in SG&A
expenses ($11 million).
Geographic Revenue
Total geographic revenue of $23,990 million decreased 12.0per-
cent as reported and 2percent adjusted for divestitures (5points)
and currency (5points) in the fourth quarter of 2014 compared to
the prior year. Major market countries decreased 10.8percent as
reported and 2percent adjusted for divestitures (4points) and cur-
rency (5points). Growth market countries decreased 15.7percent
as reported and 2percent adjusted for divestitures (9points) and
currency (5points).
In the growth markets, the year-to-year performance adjusted
for currency and the divestitures improved by approximately
2points from the third quarter. This improvement was driven by
performance in China which decreased 19.9percent as reported,
but only 1percent adjusted for divestitures (18points) and cur-
rency (1point). On an adjusted basis, this represented a significant
sequential improvement compared to the prior quarter. China’s
fourth quarter performance was driven by strength in software
and several large mainframe transactions, with four of the compa-
ny’s five largest banking clients in China adding substantial new
mainframe capacity. Within the BRIC countries, combined revenue
decreased 21.4percent as reported and 8percent adjusted for
divestitures (9points) and currency (4points) in the fourth quar-
ter. On an adjusted basis, this performance was consistent with
the third quarter, with the improvement in China offset by weaker
performance in Brazil.
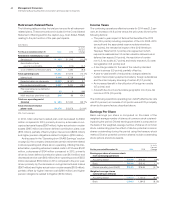
Americas revenue of $11,090 million decreased 9.0percent
as reported and 4percent adjusted for divestitures (3points)
and currency (2points) compared to the fourth quarter of 2013.
North America declined 8.1percent as reported and 4percent
adjusted for divestitures (3points) and currency (1point). The
Latin American growth markets declined 14.7percent as reported
and 4percent adjusted for divestitures (4points) and currency
(7points). The decrease in North America was driven by declines
in Global Business Services, though signings grew for the second
consecutive quarter. Declines in the Latin American growth mar-
kets were driven by the weak performance in Brazil.