IBM 2014 Annual Report Download - page 75
Download and view the complete annual report
Please find page 75 of the 2014 IBM annual report below. You can navigate through the pages in the report by either clicking on the pages listed below, or by using the keyword search tool below to find specific information within the annual report.-
 1
1 -
2
-
3
-
4
-
5
-
6
-
7
-
8
-
9
-
10
-
11
-
12
-
13
-
14
-
15
-
16
-
17
-
18
-
19
-
20
-
21
-
22
-
23
-
24
-
25
-
26
-
27
-
28
-
29
-
30
-
31
-
32
-
33
-
34
-
35
-
36
-
37
-
38
-
39
-
40
-
41
-
42
-
43
-
44
-
45
-
46
-
47
-
48
-
49
-
50
-
51
-
52
-
53
-
54
-
55
-
56
-
57
-
58
-
59
-
60
-
61
-
62
-
63
-
64
-
 65
65 -
 66
66 -
 67
67 -
 68
68 -
 69
69 -
 70
70 -
 71
71 -
 72
72 -
 73
73 -
 74
74 -
 75
75 -
 76
76 -
 77
77 -
 78
78 -
 79
79 -
 80
80 -
 81
81 -
 82
82 -
 83
83 -
 84
84 -
 85
85 -
86
-
87
-
88
-
89
-
90
-
91
-
92
-
93
-
94
-
95
-
96
-
97
-
98
-
99
-
100
-
101
-
102
-
103
-
104
-
105
-
106
-
107
-
108
-
109
-
110
-
111
-
112
-
113
-
114
-
115
-
116
-
117
-
118
-
119
-
120
-
121
-
122
-
123
-
124
-
125
-
126
-
127
-
128
-
129
-
130
-
131
-
132
-
133
-
134
-
135
-
136
-
137
-
138
-
139
-
140
-
141
-
142
-
143
-
144
-
145
-
146
-
147
-
148
-
149
-
150
-
151
-
152
-
153
-
154
-
155
-
156
-
157
-
158
 |
 |

74 Management Discussion
International Business Machines Corporation and Subsidiary Companies
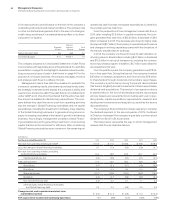
Total revenue in 2014 increased $218 million versus 2013 as a
result of:
• An increase in internal revenue of 9.0percent driven by an
increase in used equipment sales revenue (up 11.1percent to
$2,080 million); partially offset by a decrease in financing
revenue (down 0.7percent to $408 million); and
• An increase in external revenue of 0.6percent (up 3percent
adjusted for currency) driven by an increase in financing
revenue (up 3.4percent to $1,543 million), partially offset by a
decrease in used equipment sales revenue (down 7.2percent
to $491 million).
The decrease in internal financing revenue was primarily due to
lower asset yields, partially offset by an increase in the average
asset balance. The increase in external financing revenue was
due to a higher average asset balance, partially offset by lower
asset yields and a decrease in remarketing lease revenue. Global
Financing gross profit increased 7.2percent compared to 2013 due
to an increase in used equipment sales gross profit, partially offset
by a decrease in financing gross profit. The gross profit margin
increased 1.3points due to an increase in the equipment sales
margin, partially offset by a decrease in the financing margin.
Total revenue in 2013 increased $232 million versus 2012 as a
result of:
• An increase in internal revenue of 10.8percent driven by an
increase in used equipment sales revenue (up 20.0percent
to $1,871 million), partially offset by a decrease in financing
revenue (down 17.9percent to $411 million); and
• An increase in external revenue of 0.4percent (3percent
adjusted for currency) driven by an increase in financing
revenue (up 1.4percent to $1,493 million), partially offset by a
decrease in used equipment sales revenue (down 2.3per-
cent to $528 million).
The decrease in internal financing revenue was primarily due to
lower asset yields and a decrease in remarketing lease revenue.
The increase in external financing revenue was due to a higher
average asset balance, partially offset by lower asset yields and
a decrease in remarketing lease revenue. Global Financing gross
profit in 2013 increased 8.0percent compared to 2012 due to
an increase in used equipment sales gross profit, partially offset
by a decrease in financing gross profit. The gross profit margin
increased 1.5points due to an increase in equipment sales mar-
gins, partially offset by a shift in mix toward lower margin used
equipment sales.
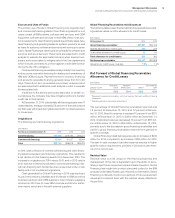
Global Financing pre-tax income increased 0.8percent in
2014 versus 2013, following an increase of 6.8percent in 2013
versus 2012. The increase in 2014 was driven by the increase in
gross profit ($207 million), partially offset by increases in financ-
ing receivables provisions ($155 million) and SG&A expenses ($32
million). The increase in 2013 was driven by the increase in gross
profit ($215 million), partially offset by increases in financing receiv-
ables provisions ($60 million) and SG&A expenses ($20 million).
The increase in financing receivable provisions in 2014 was due to
higher specific reserve requirements, primarily in China and Latin
America. At December31, 2014, the overall allowance for credit
losses coverage rate was 1.9percent, an increase of 70 basis
points year over year.
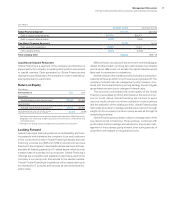
The decreases in return on equity from 2013 to 2014 and 2012
to 2013 were driven by higher average equity balances.
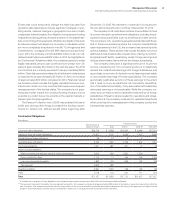
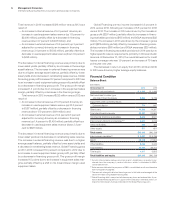
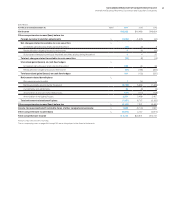
Financial Condition
Balance Sheet
($ in millions)
At December 31: 2014 2013
Cash and cash equivalents $ 1,538 $ 1,446
Net investment in sales-type
and direct financing leases 8,263 9,739
Equipment under operating leases:
External clients
(a) 774 947
Client loans 14,290 14,297
Total client financing assets 23,327 24,982
Commercial financing receivables 8,424 8,541
Intercompany financing receivables
(b)(c) 4,611 4,216
Other receivables 368 352
Other assets 577 601
Total assets $38,845 $40,138
Intercompany payables
(b) $ 3,631 $ 5,766
Debt
(d) 29,103 27,504
Other liabilities 2,094 3,043
Total liabilities 34,828 36,314
Total equity 4,017 3,825
Total liabilities and equity $38,845 $40,138
(a)
Includes intercompany markup, priced on an arm’s-length basis, on products pur-
chased from the company’s product divisions, which is eliminated in IBM’s
consolidated results.
(b) Entire amount eliminated for purposes of IBM’s consolidated results and therefore
does not appear on page 82.
(c) These assets, along with all other financing assets in this table, are leveraged at the
value in the table using Global Financing debt.
(d)
Global Financing debt is comprised of intercompany loans and external debt. A por-
tion of Global Financing debt is in support of the company’s internal business, or
related to intercompany markup embedded in the Global Financing assets.