IBM 2014 Annual Report Download - page 38
Download and view the complete annual report
Please find page 38 of the 2014 IBM annual report below. You can navigate through the pages in the report by either clicking on the pages listed below, or by using the keyword search tool below to find specific information within the annual report.-
 1
1 -
2
-
3
-
4
-
5
-
6
-
7
-
8
-
9
-
10
-
11
-
12
-
13
-
14
-
15
-
16
-
17
-
18
-
19
-
20
-
21
-
22
-
23
-
24
-
25
-
26
-
27
-
 28
28 -
 29
29 -
 30
30 -
 31
31 -
 32
32 -
 33
33 -
 34
34 -
 35
35 -
 36
36 -
 37
37 -
 38
38 -
 39
39 -
 40
40 -
 41
41 -
 42
42 -
 43
43 -
 44
44 -
 45
45 -
 46
46 -
 47
47 -
 48
48 -
49
-
50
-
51
-
52
-
53
-
54
-
55
-
56
-
57
-
58
-
59
-
60
-
61
-
62
-
63
-
64
-
65
-
66
-
67
-
68
-
69
-
70
-
71
-
72
-
73
-
74
-
75
-
76
-
77
-
78
-
79
-
80
-
81
-
82
-
83
-
84
-
85
-
86
-
87
-
88
-
89
-
90
-
91
-
92
-
93
-
94
-
95
-
96
-
97
-
98
-
99
-
100
-
101
-
102
-
103
-
104
-
105
-
106
-
107
-
108
-
109
-
110
-
111
-
112
-
113
-
114
-
115
-
116
-
117
-
118
-
119
-
120
-
121
-
122
-
123
-
124
-
125
-
126
-
127
-
128
-
129
-
130
-
131
-
132
-
133
-
134
-
135
-
136
-
137
-
138
-
139
-
140
-
141
-
142
-
143
-
144
-
145
-
146
-
147
-
148
-
149
-
150
-
151
-
152
-
153
-
154
-
155
-
156
-
157
-
158
 |
 |

37
Management Discussion
International Business Machines Corporation and Subsidiary Companies
($ in millions)
For the year ended December 31: 2014 2013
Yr.-to-Yr.
Percent/
Margin
Change
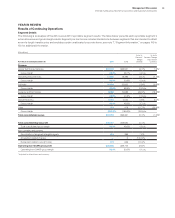
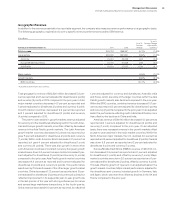
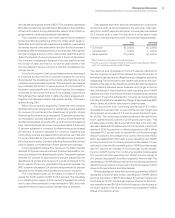
Software
External gross profit $22,533 $23,032 (2.2)%
External gross profit margin 88.6% 88.8% (0.2) pts.
Pre-tax income $10,699 $11,106 (3.7)%
Pre-tax margin 37.0% 38.1% (1.2) pts.
Software gross profit decreased 2.2percent, with a gross profit
margin of 88.6percent. Software pre-tax income decreased
3.7percent year to year and pre-tax margin declined 1.2points.
Across software, the company continues to drive innovation and
capture growth areas, integrating analytics and security capabili-
ties that are needed to operate seamlessly in a hybrid environment.
For example, the company is introducing several new offerings
that further enable its analytics portfolio in a cloud environment.
It recently announced IBM Verse, a cloud based email and col-
laboration offering that integrates Watson capabilities. This type of
continued innovation in offerings, together with expanding services
on the Bluemix platform-as-a-service, will better allow customers
to move to a hybrid environment.
Information Management revenue decreased 4.1percent
(3percent adjusted for currency) in 2014 compared to the prior
year. With the acquisition of Cloudant, the company has added
database-as-a-service capability. Cloudant extends the com-
pany’s mobile and cloud platforms by enabling developers to
easily and quickly create next-generation mobile and Web-based
applications.
Workforce Solutions revenue decreased 6.1percent (5percent
adjusted for currency) in 2014 compared to the prior year. Perfor-
mance has been impacted by the transition from on premise Notes
to SaaS offerings. The company is working to transform this busi-
ness and build recurring revenue streams from the SaaS offerings.
Tivoli revenue increased 2.0percent (3percent adjusted for
currency) in 2014 compared to the prior year. Year-to-year revenue
growth was driven by security software, which grew at double
digit rates again this year. As cybersecurity threats are a key issue
faced by all customers, these strong results are being driven in
part by incremental requirements for security with the expansion
into cloud and mobile computing.
Rational revenue decreased 3.3percent (1percent adjusted
for currency) in 2014year over year.
Operating systems revenue decreased 13.4percent (13percent
adjusted for currency) in 2014 compared to 2013. This decline was
primarily driven by declines in Power Systems.
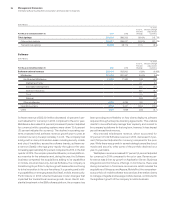
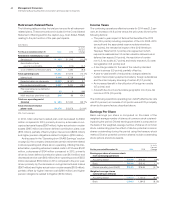
Systems and Technology
($ in millions)
For the year ended December 31: 2014 2013
Yr.-to-Yr.
Percent
Change
Yr.-to-Yr.
Percent Change
Adjusted for
Currency
Systems and Technology external revenue $9,996 $12,988 (23.0)% (16.8)%*
Systemz (23.3)% (22.6)%
Power Systems (18.9) (18.2)
Storage (12.0) (11.0)
System x (35.1) (34.9)
* Adjusted for divestitures and currency.
Systems and Technology (STG) revenue of $9,996 million
decreased 23.0percent as reported in 2014, 17percent adjusted
for the divestiture of the industry standard server business
(5points) and currency (1 point). In 2013, the STG business reported
a profit decline of $1,653 million compared to 2012. During 2014, the
company worked to reposition this business and to stabilize profit.
It divested the industry standard server business and announced
the divestiture of the Microelectronics business. Performance in
2014 reflected year-to-year declines related to the Systemz prod-
uct cycle as well as declines in Power Systems and Storage. STG
grew profit in the fourth quarter, and was profitable for the year.
Profit performance year to year was impacted by the divestiture
and currency, in addition to the revenue impacts.
Systemz revenue decreased 23.3percent (23percent ad justed
for currency) compared to the prior year. The fourth quarter of 2014
marked the tenth quarter of the current product cycle. In Janu-
ary 2015, the company announced the z13, the new generation
mainframe. The z13 system culminates a billion dollar investment
and five years of development, leverages the innovation of more
than 500 new patents and represents a collaboration with more
than 60 clients. The result of this effort is a mainframe that has the
world’s fastest processor that can execute two-and-a-half billion
transactions a day. With this generation of mainframe, the com-
pany has dramatically enhanced its capabilities around analytics,