IBM 2014 Annual Report Download - page 52
Download and view the complete annual report
Please find page 52 of the 2014 IBM annual report below. You can navigate through the pages in the report by either clicking on the pages listed below, or by using the keyword search tool below to find specific information within the annual report.-
 1
1 -
2
-
3
-
4
-
5
-
6
-
7
-
8
-
9
-
10
-
11
-
12
-
13
-
14
-
15
-
16
-
17
-
18
-
19
-
20
-
21
-
22
-
23
-
24
-
25
-
26
-
27
-
28
-
29
-
30
-
31
-
32
-
33
-
34
-
35
-
36
-
37
-
38
-
39
-
40
-
41
-
 42
42 -
 43
43 -
 44
44 -
 45
45 -
 46
46 -
 47
47 -
 48
48 -
 49
49 -
 50
50 -
 51
51 -
 52
52 -
 53
53 -
 54
54 -
 55
55 -
 56
56 -
 57
57 -
 58
58 -
 59
59 -
 60
60 -
 61
61 -
 62
62 -
63
-
64
-
65
-
66
-
67
-
68
-
69
-
70
-
71
-
72
-
73
-
74
-
75
-
76
-
77
-
78
-
79
-
80
-
81
-
82
-
83
-
84
-
85
-
86
-
87
-
88
-
89
-
90
-
91
-
92
-
93
-
94
-
95
-
96
-
97
-
98
-
99
-
100
-
101
-
102
-
103
-
104
-
105
-
106
-
107
-
108
-
109
-
110
-
111
-
112
-
113
-
114
-
115
-
116
-
117
-
118
-
119
-
120
-
121
-
122
-
123
-
124
-
125
-
126
-
127
-
128
-
129
-
130
-
131
-
132
-
133
-
134
-
135
-
136
-
137
-
138
-
139
-
140
-
141
-
142
-
143
-
144
-
145
-
146
-
147
-
148
-
149
-
150
-
151
-
152
-
153
-
154
-
155
-
156
-
157
-
158
 |
 |

51
Management Discussion
International Business Machines Corporation and Subsidiary Companies
EMEA revenue of $8,001 million decreased 12.8percent as
reported, but only 1percent adjusted for divestitures (5points)
and currency (7points) year to year in the fourth quarter of 2014.
Major market countries were down 13.2percent as reported
and 2percent adjusted for divestitures (4points) and currency
(7points). Growth market countries were down 9.7percent,
but were up 7percent adjusted for divestitures (10points) and
currency (6points). On an adjusted basis, Europe’s overall perfor
-
mance improved from the third quarter. In the major markets, there
were improvements in the UK and Italy, and continued growth in
Spain. Compared to the prior year, the UK decreased 10.0percent
as reported and 1percent adjusted for divestitures (7points) and
currency (2points) compared with a decline of 5percent on an
adjusted basis in the prior quarter. Italy decreased 7.5percent as
reported, but grew 5percent adjusted for divestitures (3points)
and currency (9points) compared with a decline of 2percent on
an adjusted basis in the prior quarter. Spain decreased 7.8per-
cent as reported, but grew 3percent adjusted for divestitures
(2points) and currency (9points). The increase in the growth mar-
kets when adjusted for currency and the divestitures was driven
by strength in the central and eastern European countries.
Asia Pacific fourth quarter revenue decreased 16.7percent as
reported and 2percent adjusted for divestitures (8points) and
currency (7points) year over year. Japan decreased 14.5percent
as reported, but grew 2percent adjusted for divestitures (4points)
and currency (12points). Asia Pacific growth market countries
decreased 18.1percent as reported and 5percent adjusted
for divestitures (11points) and currency (3points) year to year.
Although there was improved performance this quarter in China
on an adjusted basis, there were continued year-to-year declines
in some of the other larger growth market countries.
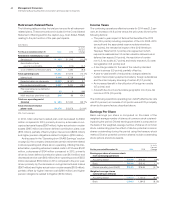
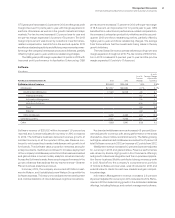
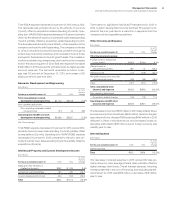
Total Expense and Other (Income)
($ in millions)
For the fourth quarter: 2014 2013
Yr.-to-Yr.
Percent/
Margin
Change
Total consolidated expense
and other (income) $5,767 $7,235 (20.3)%
Non-operating adjustments
Amortization of acquired
intangible assets (93) (93) (0.1)
Acquisition-related charges (2) (16) (87.5)
Non-operating retirement-related
(costs)/income (74) (104) (28.5)
Operating (non-GAAP)
expense and other (income) $5,598 $7,023 (20.3)%
Total consolidated
expense-to-revenue ratio 23.9% 26.4%(2.5) pts.
Operating (non-GAAP)
expense-to-revenue ratio 23.2% 25.6%(2.4) pts.
Total expense and other (income) decreased 20.3percent in the
fourth quarter with an expense-to-revenue ratio of 23.9percent
compared to 26.4percent in the fourth quarter of 2013. Total oper-
ating (non-GAAP) expense and other (income) also decreased
20.3percent in the fourth quarter. The decrease in total oper-
ating expense and other (income) was primarily driven by lower
base expense (17points) and currency (4points), partially offset
by increased expense from acquisitions over the past 12 months
(1point). The decline in base expense was driven by the gain
from the industry standard server divestiture, partially offset by
the workforce reduction charge recorded in the fourth quarter.
Other (income)/expense included the pre-tax gain from the indus-
try standard server divestiture of $1.4 billion; while selling, general
and administrative expense included the workforce rebalancing
change of approximately $580 million. Additionally, expense asso-
ciated with the industry standard server business is no longer in
the run rate which also contributed to the year-to-year decline in
the fourth quarter.
Results of Discontinued Operations
Loss from discontinued operations, net of tax, was $31 million in
the fourth quarter of 2014 compared to $32 million in 2013.
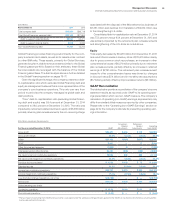
Cash Flow
The company generated $6,059 million in cash flow provided by
operating activities, a decrease of $468 million compared to the
fourth quarter of 2013, driven primarily by declines in operational
performance within net income and an increase in cash taxes paid
($203 million). Net cash used in investing activities of $1,236 mil-
lion decreased $1,666 million compared to the prior year, primarily
due to cash proceeds received from the divestiture of the industry
standard server business. Net cash used in financing activities
of $5,699 million increased $2,686 million compared to the prior
year primarily due to debt retirements during the quarter, offset
by decreased cash used for gross common stock repurchases
($5,665 million).