IBM 2014 Annual Report Download - page 61
Download and view the complete annual report
Please find page 61 of the 2014 IBM annual report below. You can navigate through the pages in the report by either clicking on the pages listed below, or by using the keyword search tool below to find specific information within the annual report.-
 1
1 -
2
-
3
-
4
-
5
-
6
-
7
-
8
-
9
-
10
-
11
-
12
-
13
-
14
-
15
-
16
-
17
-
18
-
19
-
20
-
21
-
22
-
23
-
24
-
25
-
26
-
27
-
28
-
29
-
30
-
31
-
32
-
33
-
34
-
35
-
36
-
37
-
38
-
39
-
40
-
41
-
42
-
43
-
44
-
45
-
46
-
47
-
48
-
49
-
50
-
 51
51 -
 52
52 -
 53
53 -
 54
54 -
 55
55 -
 56
56 -
 57
57 -
 58
58 -
 59
59 -
 60
60 -
 61
61 -
 62
62 -
 63
63 -
 64
64 -
 65
65 -
 66
66 -
 67
67 -
 68
68 -
 69
69 -
 70
70 -
 71
71 -
72
-
73
-
74
-
75
-
76
-
77
-
78
-
79
-
80
-
81
-
82
-
83
-
84
-
85
-
86
-
87
-
88
-
89
-
90
-
91
-
92
-
93
-
94
-
95
-
96
-
97
-
98
-
99
-
100
-
101
-
102
-
103
-
104
-
105
-
106
-
107
-
108
-
109
-
110
-
111
-
112
-
113
-
114
-
115
-
116
-
117
-
118
-
119
-
120
-
121
-
122
-
123
-
124
-
125
-
126
-
127
-
128
-
129
-
130
-
131
-
132
-
133
-
134
-
135
-
136
-
137
-
138
-
139
-
140
-
141
-
142
-
143
-
144
-
145
-
146
-
147
-
148
-
149
-
150
-
151
-
152
-
153
-
154
-
155
-
156
-
157
-
158
 |
 |

60 Management Discussion
International Business Machines Corporation and Subsidiary Companies
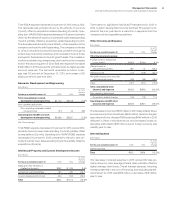
Total geographic revenue of $97,800 million decreased 4.4per-
cent (2percent adjusted for currency) in 2013. Revenue in the
major markets decreased 4.2percent (2percent adjusted for
currency). Revenue from the growth markets, which represented
approximately 23percent of the total geographic revenue for the
year, decreased 4.9percent on a year-to-year basis (2percent
adjusted for currency). Performance at constant currency in the
growth markets was mixed, with year-to-year growth in the first half
offset by declines in the second half. The company had strength
in Latin America and the Middle East and Africa region. How-
ever, declines in some of the larger growth markets, for example
China and Australia, impacted the overall performance in the
growth markets. Within the BRIC countries of Brazil, Russia, India
and China, combined revenue declined 8.2percent (6percent
adjusted for currency).
Americas revenue decreased 2.9percent (2percent adjusted
for currency) year to year. The major market countries were down
3.9percent (4percent adjusted for currency), partially offset by an
increase in the Latin America growth markets of 4.4percent (9per-
cent adjusted for currency). Within the major market countries,
the U.S. was down 3.4percent and Canada was down 6.3per-
cent (3percent adjusted for currency). Within the growth market
countries, Brazil increased 3.3percent (10percent adjusted for
currency) and Mexico increased 7.8percent (8percent adjusted
for currency).
Europe/Middle East/Africa revenue decreased 0.5percent
(2percent adjusted for currency) compared to 2012. The major
market countries were down 0.5percent (3percent adjusted for
currency), while the growth market countries were down 0.6percent
(up 1percent adjusted for currency). In the major market countries,
the UK decreased 1.4percent (flat adjusted for currency), Germany
decreased 0.1percent (3percent adjusted for currency), France
decreased 1.8percent (5percent adjusted for currency), and Italy
decreased 2.1percent (5percent adjusted for currency). Within
the EMEA growth markets, the Middle East and Africa region
increased 5.0percent (11percent adjusted for currency), but this
growth was offset primarily by a decrease in Russia of 22.7percent
(22percent adjusted for currency).
Asia Pacific revenue decreased 11.6percent (3percent
adjusted for currency) year to year. Japan revenue decreased
15.2percent as reported, but increased 4percent overall and
grew in every quarter on a constant currency basis. This growth
reflected the benefits of shifting investment and redirection of the
company’s go-to-market focus to improve performance in Japan.
The Asia Pacific growth markets decreased 9.1percent (7percent
adjusted for currency), with China down 12.2percent (14percent
adjusted for currency) and Australia down 15.9percent (10per-
cent adjusted for currency). During 2013, performance in China
was impacted by the process surrounding the implementation of
a broad governmental economic reform plan.
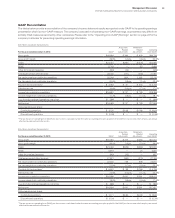
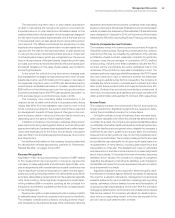
Total Expense and Other (Income)
($ in millions)
For the year ended December 31: 2013 2012
Yr.-to-Yr.
Percent/
Margin
Change
Total consolidated expense
and other (income) $28,440 $27,821 2.2%
Non-operating adjustments
Amortization of acquired
intangible assets (370) (328) 12.9
Acquisition-related charges (40) (35) 14.9
Non-operating retirement-related
(costs)/income (433) (274)58.3
Operating (non-GAAP)
expense and other (income) $27,597 $27,184 1.5%
Total consolidated
expense-to-revenue ratio 28.9% 27.0%1.9 pts.
Operating (non-GAAP)
expense-to-revenue ratio 28.1%26.4%1.7 pts.
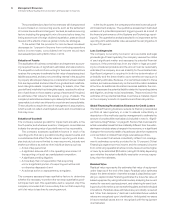
Selling, General and Administrative
($ in millions)
For the year ended December 31: 2013 2012
Yr.-to-Yr.
Percent
Change
Selling, general and
administrative expense
Selling, general and
administrative—other $19,178 $19,532 (1.8)%
Advertising and promotional
expense 1,294 1,339 (3.4)
Workforce rebalancing charges 1,031 784 31.6
Retirement-related costs 986 932 5.8
Amortization of acquired
intangible assets 370 328 12.9
Stock-based compensation 435 498 (12.6)
Bad debt expense 156 50 209.8
Total consolidated selling, general
and administrative expense $23,451 $23,463 (0.1)%
Non-operating adjustments
Amortization of acquired
intangible assets (370)(328)12.9
Acquisition-related charges (25)(22)13.3
Non-operating retirement-related
(costs)/income (376)(294)28.1
Operating (non-GAAP)
selling, general and
administrative expense $22,680 $22,820 (0.6)%