IBM 2014 Annual Report Download - page 41
Download and view the complete annual report
Please find page 41 of the 2014 IBM annual report below. You can navigate through the pages in the report by either clicking on the pages listed below, or by using the keyword search tool below to find specific information within the annual report.-
 1
1 -
2
-
3
-
4
-
5
-
6
-
7
-
8
-
9
-
10
-
11
-
12
-
13
-
14
-
15
-
16
-
17
-
18
-
19
-
20
-
21
-
22
-
23
-
24
-
25
-
26
-
27
-
28
-
29
-
30
-
 31
31 -
 32
32 -
 33
33 -
 34
34 -
 35
35 -
 36
36 -
 37
37 -
 38
38 -
 39
39 -
 40
40 -
 41
41 -
 42
42 -
 43
43 -
 44
44 -
 45
45 -
 46
46 -
 47
47 -
 48
48 -
 49
49 -
 50
50 -
 51
51 -
52
-
53
-
54
-
55
-
56
-
57
-
58
-
59
-
60
-
61
-
62
-
63
-
64
-
65
-
66
-
67
-
68
-
69
-
70
-
71
-
72
-
73
-
74
-
75
-
76
-
77
-
78
-
79
-
80
-
81
-
82
-
83
-
84
-
85
-
86
-
87
-
88
-
89
-
90
-
91
-
92
-
93
-
94
-
95
-
96
-
97
-
98
-
99
-
100
-
101
-
102
-
103
-
104
-
105
-
106
-
107
-
108
-
109
-
110
-
111
-
112
-
113
-
114
-
115
-
116
-
117
-
118
-
119
-
120
-
121
-
122
-
123
-
124
-
125
-
126
-
127
-
128
-
129
-
130
-
131
-
132
-
133
-
134
-
135
-
136
-
137
-
138
-
139
-
140
-
141
-
142
-
143
-
144
-
145
-
146
-
147
-
148
-
149
-
150
-
151
-
152
-
153
-
154
-
155
-
156
-
157
-
158
 |
 |

40 Management Discussion
International Business Machines Corporation and Subsidiary Companies
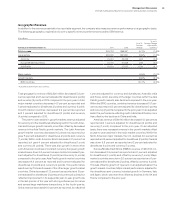
Asia Pacific revenue of $20,216 million decreased 11.8percent
as reported and 4percent adjusted for the divested businesses
(3points) and currency (5points). Japan was down 7.6percent
as reported, but increased 3percent adjusted for divestitures
(3points) and currency (8points). On this basis, Japan reflected
year-to-year growth in every quarter of 2014. However, this growth
was more than offset by declines in the Asia Pacific growth markets.
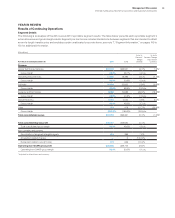
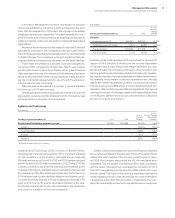
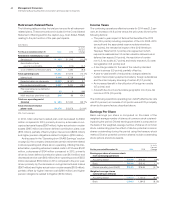
Total Expense and Other (Income)
($ in millions)
For the year ended December 31: 2014 2013
Yr.-to-Yr.
Percent/
Margin
Change
Total consolidated expense
and other (income) $26,421 $28,440 (7.1)%
Non-operating adjustments
Amortization of acquired
intangible assets (374) (370) 1.2
Acquisition-related charges (12) (40) (70.0)
Non-operating retirement-related
(costs)/income (180) (433) (58.4)
Operating (non-GAAP)
expense and other (income) $25,855 $27,597 (6.3)%
Total consolidated
expense-to-revenue ratio 28.5% 28.9% (0.4) pts.
Operating (non-GAAP)
expense-to-revenue ratio 27.9% 28.1% (0.2) pts.
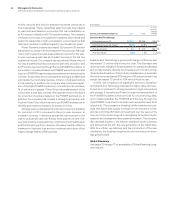
The key drivers of the year-to-year change in total expense and
other (income) were approximately:
Total Operating
Consolidated (non-GAAP)
• Currency* (1) point (1) point
• Acquisitions** 2 points 2 points
• Base expense (8) points (7) points
* Reflects impacts of translation and hedging programs.
** Includes acquisitions completed in prior 12-month period; operating (non-GAAP) is
net of non-operating acquisition-related charges.
Base expense includes the gains from the divestitures of the indus-
try standard server and customer care businesses, as well as the
impact of higher workforce rebalancing charges year to year.
Excluding the gains from the divested businesses and the impact
of workforce rebalancing, operating (non-GAAP) base expense
decreased 3points year to year versus the 7point as reported
decrease. Within base expense, the company is continuing to shift
its resources and spending to the strategic imperatives.
For additional information regarding total expense and other
(income) for both expense presentations, see the following analy-
ses by category.
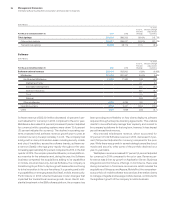
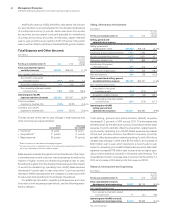
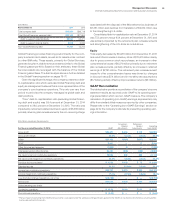
Selling, General and Administrative
($ in millions)
For the year ended December 31: 2014 2013
Yr.-to-Yr.
Percent
Change
Selling, general and
administrative expense
Selling, general and
administrative—other $18,532 $19,178 (3.4)%
Advertising and promotional expense 1,307 1,294 1.1
Workforce rebalancing charges 1,472 1,031 42.7
Retirement-related costs 811 986 (17.8)
Amortization of acquired
intangible assets 374 370 1.2
Stock-based compensation 350 435 (19.4)
Bad debt expense 334 156 113.8
Total consolidated selling, general
and administrative expense $23,180 $23,451 (1.2)%
Non-operating adjustments
Amortization of acquired
intangible assets (374) (370) 1.2
Acquisition-related charges (11) (25) (54.1)
Non-operating retirement-related
(costs)/income (257) (376) (31.7)
Operating (non-GAAP)
selling, general and
administrative expense $22,537 $22,680 (0.6)%
Total selling, general and administrative (SG&A) expense
decreased 1.2percent in 2014 versus 2013. The decrease was
primarily driven by the effects of currency (2points) and lower base
expense (1point), partially offset by acquisition-related spend-
ing (2points). Operating (non-GAAP) SG&A expense decreased
0.6percent primarily driven by the effects of currency (2points),
partially offset by acquisition-related spending (1point). Workforce
rebalancing charges in 2014 were $1,472 million, an increase of
$440 million year to year, which resulted in a 2point year-to-year
impact in operating (non-GAAP) SG&A base expense. Bad debt
expense increased $178 million year to year driven by higher spe-
cific provision additions, primarily in China and Latin America. The
receivables provision coverage was 2.2percent at December31,
2014, an increase of 60 basispoints from year-end 2013.
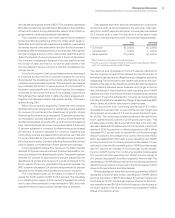
Research, Development and Engineering
($ in millions)
For the year ended December 31: 2014 2013
Yr.-to-Yr.
Percent
Change
Total consolidated research,
development and engineering $5,437 $5,743 (5.3)%
Non-operating adjustment
Non-operating retirement-related
(costs)/income 77 (57) NM
Operating (non-GAAP) research,
development and engineering $5,514 $5,686 (3.0)%
NM—Not meaningful