IBM 2014 Annual Report Download - page 45
Download and view the complete annual report
Please find page 45 of the 2014 IBM annual report below. You can navigate through the pages in the report by either clicking on the pages listed below, or by using the keyword search tool below to find specific information within the annual report.-
 1
1 -
2
-
3
-
4
-
5
-
6
-
7
-
8
-
9
-
10
-
11
-
12
-
13
-
14
-
15
-
16
-
17
-
18
-
19
-
20
-
21
-
22
-
23
-
24
-
25
-
26
-
27
-
28
-
29
-
30
-
31
-
32
-
33
-
34
-
 35
35 -
 36
36 -
 37
37 -
 38
38 -
 39
39 -
 40
40 -
 41
41 -
 42
42 -
 43
43 -
 44
44 -
 45
45 -
 46
46 -
 47
47 -
 48
48 -
 49
49 -
 50
50 -
 51
51 -
 52
52 -
 53
53 -
 54
54 -
 55
55 -
56
-
57
-
58
-
59
-
60
-
61
-
62
-
63
-
64
-
65
-
66
-
67
-
68
-
69
-
70
-
71
-
72
-
73
-
74
-
75
-
76
-
77
-
78
-
79
-
80
-
81
-
82
-
83
-
84
-
85
-
86
-
87
-
88
-
89
-
90
-
91
-
92
-
93
-
94
-
95
-
96
-
97
-
98
-
99
-
100
-
101
-
102
-
103
-
104
-
105
-
106
-
107
-
108
-
109
-
110
-
111
-
112
-
113
-
114
-
115
-
116
-
117
-
118
-
119
-
120
-
121
-
122
-
123
-
124
-
125
-
126
-
127
-
128
-
129
-
130
-
131
-
132
-
133
-
134
-
135
-
136
-
137
-
138
-
139
-
140
-
141
-
142
-
143
-
144
-
145
-
146
-
147
-
148
-
149
-
150
-
151
-
152
-
153
-
154
-
155
-
156
-
157
-
158
 |
 |

44 Management Discussion
International Business Machines Corporation and Subsidiary Companies
• An increase of $1,322 million ($1,378 million adjusted for
currency) in other receivables driven by anticipated tax
refunds; and
• An increase in deferred taxes of $394 million ($507 million
adjusted for currency) primarily due to the expected Micro-
electronics business divestiture.
Current liabilities decreased $554 million (an increase of $1,623
million adjusted for currency), as a result of:
• A decrease in short-term debt of $1,131 million ($1,074 million
adjusted for currency); and
• A decrease in deferred income of $680 million (an increase of
$42 million adjusted for currency) driven by currency; partially
offset by
• Other accrued expenses and liabilities increases of $1,265
million ($1,840 million adjusted for currency) driven by
charges and expected payments related to the expected
divestiture of the Microelectronics business and workforce
rebalancing accruals.
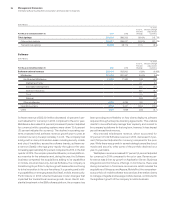
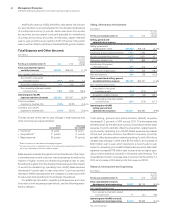
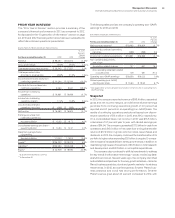
Cash Flow
The company’s cash flows from operating, investing and financ-
ing activities, as reflected in the Consolidated Statement of Cash
Flows on page 83 are summarized in the table below. These
amounts include the cash flows associated with the Global Financ-
ing business.
($ in millions)
For the year ended December 31: 2014 2013
Net cash provided by/(used in) continuing
operations
Operating activities $ 16,868 $17,485
Investing activities (3,001) (7,326)
Financing activities (15,452) (9,883)
Effect of exchange rate changes on
cash and cash equivalents (655) 28
Net change in cash and cash equivalents $ (2,240) $ 304
Net cash provided by operating activities decreased by $616 mil-
lion in 2014 driven by the following key factors:
• An increase in income taxes paid of $1,724 million primarily
driven by audit settlement payments and other prior period
discrete tax impacts settled in 2014;
• A decrease in cash associated with deferred income of $814
million due to lower levels of customer prepayments; and
• Performance-related declines within net income; partially
offset by
• An increase in cash provided by receivables of $2,676 million,
primarily driven by financing receivables; and
• A decrease in cash payments for performance-related com-
pensation of $772 million.
Net cash used in investing activities decreased $4,325 million
driven by:
• A decrease in cash used for acquisitions of $2,401 million; and
• An increase in cash provided by divestitures of $2,061 million.
Net cash used in financing activities increased $5,569 million as
compared to the prior year driven by the following factors:
• Lower cash from debt transactions (including short-term
borrowings) of $5,177 million; and
• An increase of $392 million in net cash used for equity trans-
actions impacted by increased dividend payments in 2014.
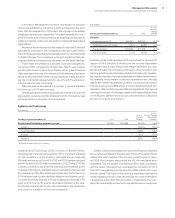
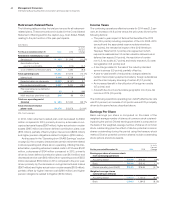
Noncurrent Assets and Liabilities
($ in millions)
At December 31: 2014 2013
Noncurrent assets $68,110 $74,873
Long-term debt $35,073 $32,856
Noncurrent liabilities (excluding debt) $30,844 $30,284
The decrease in noncurrent assets of $6,763 million ($3,790 million
adjusted for currency) was driven by:
• A decrease of $3,392 million ($3,260 million adjusted for
currency) in prepaid pension assets primarily driven by plan
remeasurements;
• A decrease in property, plant and equipment, net of $3,050
million ($2,381 million adjusted for currency) primarily driven
by a charge of $2,358 million associated with the expected
divestiture of the Microelectronics business; and
• A decrease of $1,646 million ($917 million adjusted for cur-
rency) in long term financing receivables; partially offset by
• An increase in deferred taxes of $1,757 million ($2,054 million
adjusted for currency) driven by retirement related plan activity.
Long-term debt increased $2,218 million ($3,042 million adjusted
for currency) driven by new debt of $7,657 million offset by
reclasses to short-term debt of $4,809 million.
Other noncurrent liabilities, excluding debt, increased $561 mil-
lion ($2,330 million adjusted for currency) primarily driven by:
• An increase in retirement and nonpension benefit obligations
of $2,019 million ($3,210 million adjusted for currency) driven
by plan remeasurements, partially offset by
• Declines of $1,041 million ($708 million adjusted for currency)
in other liabilities driven by declines in deferred taxes.
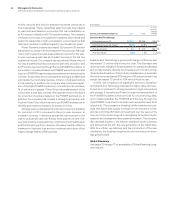
Debt
The company’s funding requirements are continually monitored
and strategies are executed to manage the overall asset and liabil-
ity profile. Additionally, the company maintains sufficient flexibility
to access global funding sources as needed.