IBM 2014 Annual Report Download - page 6
Download and view the complete annual report
Please find page 6 of the 2014 IBM annual report below. You can navigate through the pages in the report by either clicking on the pages listed below, or by using the keyword search tool below to find specific information within the annual report.-
 1
1 -
 2
2 -
 3
3 -
 4
4 -
 5
5 -
 6
6 -
 7
7 -
 8
8 -
 9
9 -
 10
10 -
 11
11 -
 12
12 -
 13
13 -
 14
14 -
 15
15 -
 16
16 -
 17
17 -
18
-
19
-
20
-
21
-
22
-
23
-
24
-
25
-
26
-
27
-
28
-
29
-
30
-
31
-
32
-
33
-
34
-
35
-
36
-
37
-
38
-
39
-
40
-
41
-
42
-
43
-
44
-
45
-
46
-
47
-
48
-
49
-
50
-
51
-
52
-
53
-
54
-
55
-
56
-
57
-
58
-
59
-
60
-
61
-
62
-
63
-
64
-
65
-
66
-
67
-
68
-
69
-
70
-
71
-
72
-
73
-
74
-
75
-
76
-
77
-
78
-
79
-
80
-
81
-
82
-
83
-
84
-
85
-
86
-
87
-
88
-
89
-
90
-
91
-
92
-
93
-
94
-
95
-
96
-
97
-
98
-
99
-
100
-
101
-
102
-
103
-
104
-
105
-
106
-
107
-
108
-
109
-
110
-
111
-
112
-
113
-
114
-
115
-
116
-
117
-
118
-
119
-
120
-
121
-
122
-
123
-
124
-
125
-
126
-
127
-
128
-
129
-
130
-
131
-
132
-
133
-
134
-
135
-
136
-
137
-
138
-
139
-
140
-
141
-
142
-
143
-
144
-
145
-
146
-
147
-
148
-
149
-
150
-
151
-
152
-
153
-
154
-
155
-
156
-
157
-
158
 |
 |

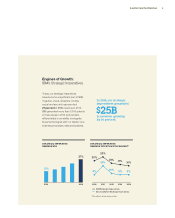
Engines of Growth:
IBM’s Strategic Imperatives
Today, our strategic imperatives
have become a significant part of IBM.
Together, cloud, analytics, mobile,
social and security represented
27 percent of IBM’s revenue in 2014.
IBM generated more than 3,000 patents
in these areas in 2014 and remains
differentiated in our ability to integrate
these technologies with our clients’ core
business processes, data and systems.
In 2014, our strategic
imperatives generated
$25B
in revenue, growing
by 16 percent.
13%
2010 2014
27%
STRATEGIC IMPERATIVE
REVENUE MIX
2010 2011 2012 20132014
20%
23%
18% 17% 16%
9% 9% 9%
16%
10%
STRATEGIC IMPERATIVE
REVENUE GROWTH VS THE MARKET*
IBM Strategic Imperatives
Served Market Strategic Imperatives
* Data reflects actual currency rates.
5A Letter from the Chairman