IBM 2014 Annual Report Download - page 67
Download and view the complete annual report
Please find page 67 of the 2014 IBM annual report below. You can navigate through the pages in the report by either clicking on the pages listed below, or by using the keyword search tool below to find specific information within the annual report.-
 1
1 -
2
-
3
-
4
-
5
-
6
-
7
-
8
-
9
-
10
-
11
-
12
-
13
-
14
-
15
-
16
-
17
-
18
-
19
-
20
-
21
-
22
-
23
-
24
-
25
-
26
-
27
-
28
-
29
-
30
-
31
-
32
-
33
-
34
-
35
-
36
-
37
-
38
-
39
-
40
-
41
-
42
-
43
-
44
-
45
-
46
-
47
-
48
-
49
-
50
-
51
-
52
-
53
-
54
-
55
-
56
-
 57
57 -
 58
58 -
 59
59 -
 60
60 -
 61
61 -
 62
62 -
 63
63 -
 64
64 -
 65
65 -
 66
66 -
 67
67 -
 68
68 -
 69
69 -
 70
70 -
 71
71 -
 72
72 -
 73
73 -
 74
74 -
 75
75 -
 76
76 -
 77
77 -
78
-
79
-
80
-
81
-
82
-
83
-
84
-
85
-
86
-
87
-
88
-
89
-
90
-
91
-
92
-
93
-
94
-
95
-
96
-
97
-
98
-
99
-
100
-
101
-
102
-
103
-
104
-
105
-
106
-
107
-
108
-
109
-
110
-
111
-
112
-
113
-
114
-
115
-
116
-
117
-
118
-
119
-
120
-
121
-
122
-
123
-
124
-
125
-
126
-
127
-
128
-
129
-
130
-
131
-
132
-
133
-
134
-
135
-
136
-
137
-
138
-
139
-
140
-
141
-
142
-
143
-
144
-
145
-
146
-
147
-
148
-
149
-
150
-
151
-
152
-
153
-
154
-
155
-
156
-
157
-
158
 |
 |

66 Management Discussion
International Business Machines Corporation and Subsidiary Companies
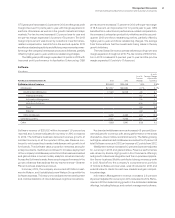
in fair value period to period based on the level of the company’s
outstanding instruments and market conditions. The company has
no other contractual arrangements that, in the event of a change in
credit rating, would result in a material adverse effect on its finan-
cial position or liquidity.
Standard
& Poor’s
Moody’s
Investors
Service
Fitch
Ratings
Senior long-term debt AA- Aa3 A+
Commercial paper A-1+ Prime-1 F1
The company prepares its Consolidated Statement of Cash Flows
in accordance with applicable accounting standards for cash flow
presentation on page 83 and highlights causes and events under-
lying sources and uses of cash in that format on page 44. For the
purpose of running its business, the company manages, monitors
and analyzes cash flows in a different format.
Management uses a free cash flow measure to evaluate the
company’s operating results, plan share repurchase levels, evalu-
ate strategic investments and assess the company’s ability and
need to incur and service debt. Free cash flow is not a defined term
under GAAP and it should not be inferred that the entire free cash
flow amount is available for discretionary expenditures. The com-
pany defines free cash flow as net cash from operating activities
less the change in Global Financing receivables and net capital
expenditures, including the investment in software. A key objective
of the Global Financing business is to generate strong returns on
equity. Increasing receivables is the basis for growth in a financing
business. Accordingly, management considers Global Financ-
ing receivables as a profit-generating investment, not as working
capital that should be minimized for efficiency. After considering
Global Financing receivables as an investment, the remaining net
operational cash flow less net capital expenditures is viewed by
the company as free cash flow.
From the perspective of how management views cash flow, in
2014, after investing $3.8 billion in capital investments, the com-
pany generated free cash flow of $12.4 billion, a decrease of $2.6
billion compared to 2013. The decrease was driven by higher cash
tax payments ($1.7 billion), the company’s operational performance
and changes in working capital associated with the divestiture of
the industry standard server business.
In 2014, the company continued to focus its cash utilization on
returning value to shareholders including $4.3 billion in dividends
and $13.0 billion in net stock transactions, including the common
stock repurchase program. In addition, $0.7 billion was utilized for
six acquisitions this year.
Over the past five years, the company generated over $78 bil-
lion in free cash flow. During that period, the company invested
$15 billion in strategic acquisitions and returned over $79 billion
to shareholders through dividends and net share repurchases.
The company’s performance during this period demonstrates
that there is fungibility across the elements of share repurchases,
dividends and acquisitions. The amount of prospective returns
to shareholders in the form of dividends and share repurchases
will vary based upon several factors including each year’s oper-
ating results, capital expenditure requirements, research and
development investments and acquisitions, as well as the factors
discussed below.
The company’s Board of Directors meets quarterly to consider
the dividend payment. In the second quarter of 2014, the Board
of Directors increased the company’s quarterly common stock
dividend from $0.95 to $1.10 per share.
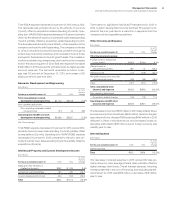
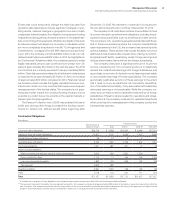
The table below represents the way in which management
reviews cash flow as described above.
($ in billions)
For the year ended December 31: 2014 2013 2012 2011 2010
Net cash from operating activities per GAAP $ 16.9 $ 17.5 $ 19.6 $ 19.8 $ 19.5
Less: the change in Global Financing receivables 0.7 (1.3) (2.9) (0.8) (0.7)
Net cash from operating activities, excluding
Global Financing receivables 16.2 18.8 22.5 20.7 20.3
Capital expenditures, net (3.8) (3.8) (4.3) (4.1) (4.0)
Free cash flow (FCF) 12.4 15.0 18.2 16.6 16.3
Acquisitions (0.7) (3.1) (3.7) (1.8) (5.9)
Divestitures 2.4 0.3 0.6 0.0 0.1
Share repurchase (13.7) (13.9) (12.0) (15.0) (15.4)
Dividends (4.3) (4.1) (3.8) (3.5) (3.2)
Non-Global Financing debt (1.3) 3.2 0.7 1.7 2.3
Other (includes Global Financing receivables
and Global Financing debt) 2.6 2.4 (0.8) 2.3 3.5
Change in cash, cash equivalents and short-term
marketable securities $ (2.6) $ (0.1)$ (0.8)$ 0.3 $ (2.3)
FCF as percent of Income from Continuing Operations 79% 89%107%103% 108%